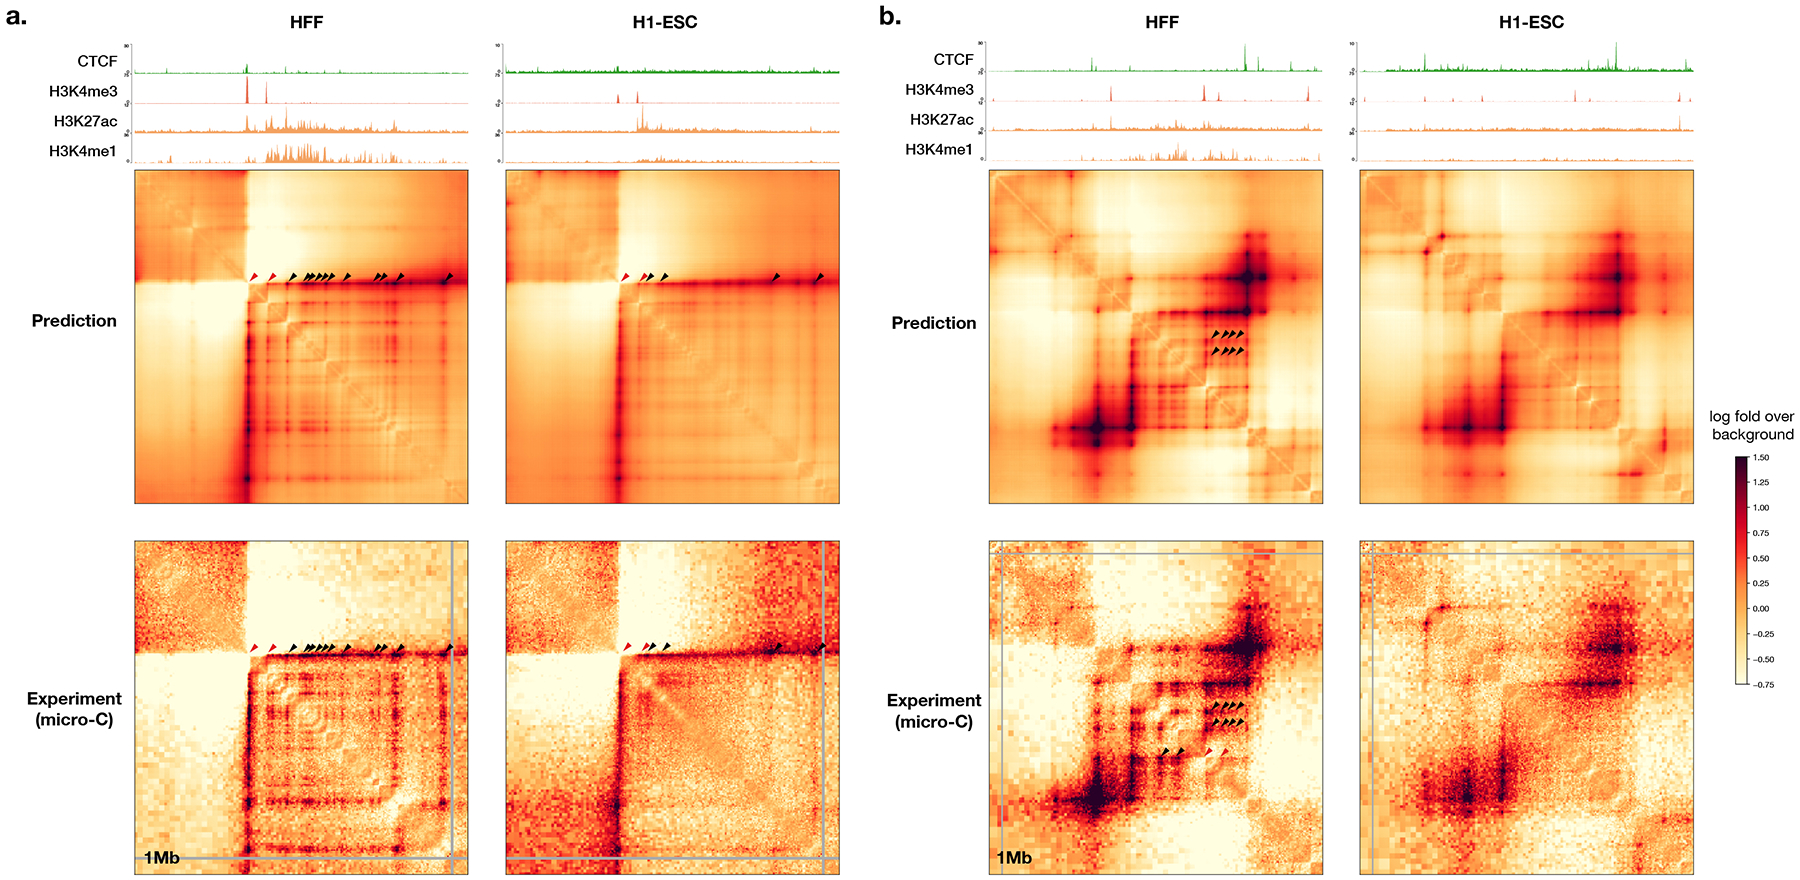
Extended Data Fig. 4. Example Orca predictions of promoter-enhancer interactions.

Predicted and observed H1-ESC and HFF genome interactions for two regions from holdout chromosomes, a) chr8:127400000-128400000 and b) chr9:94360000-95360000 are shown. The predicted and observed enhancer-promoter interactions are marked (promoter positions or promoter-promoter interactions are marked with red triangles, enhancer-promoter or enhancer-enhancer interactions are marked with black triangles; we only marked a subset of all interactions observed). ChIP-seq signal tracks for CTCF and H3K4me3, H3K27ac, and H3K4me1 for the two cell types are also shown. The predicted enhancer-promoter interactions are consistent with micro-C observations and enhancer histone mark signal from ChIP-seq data.
