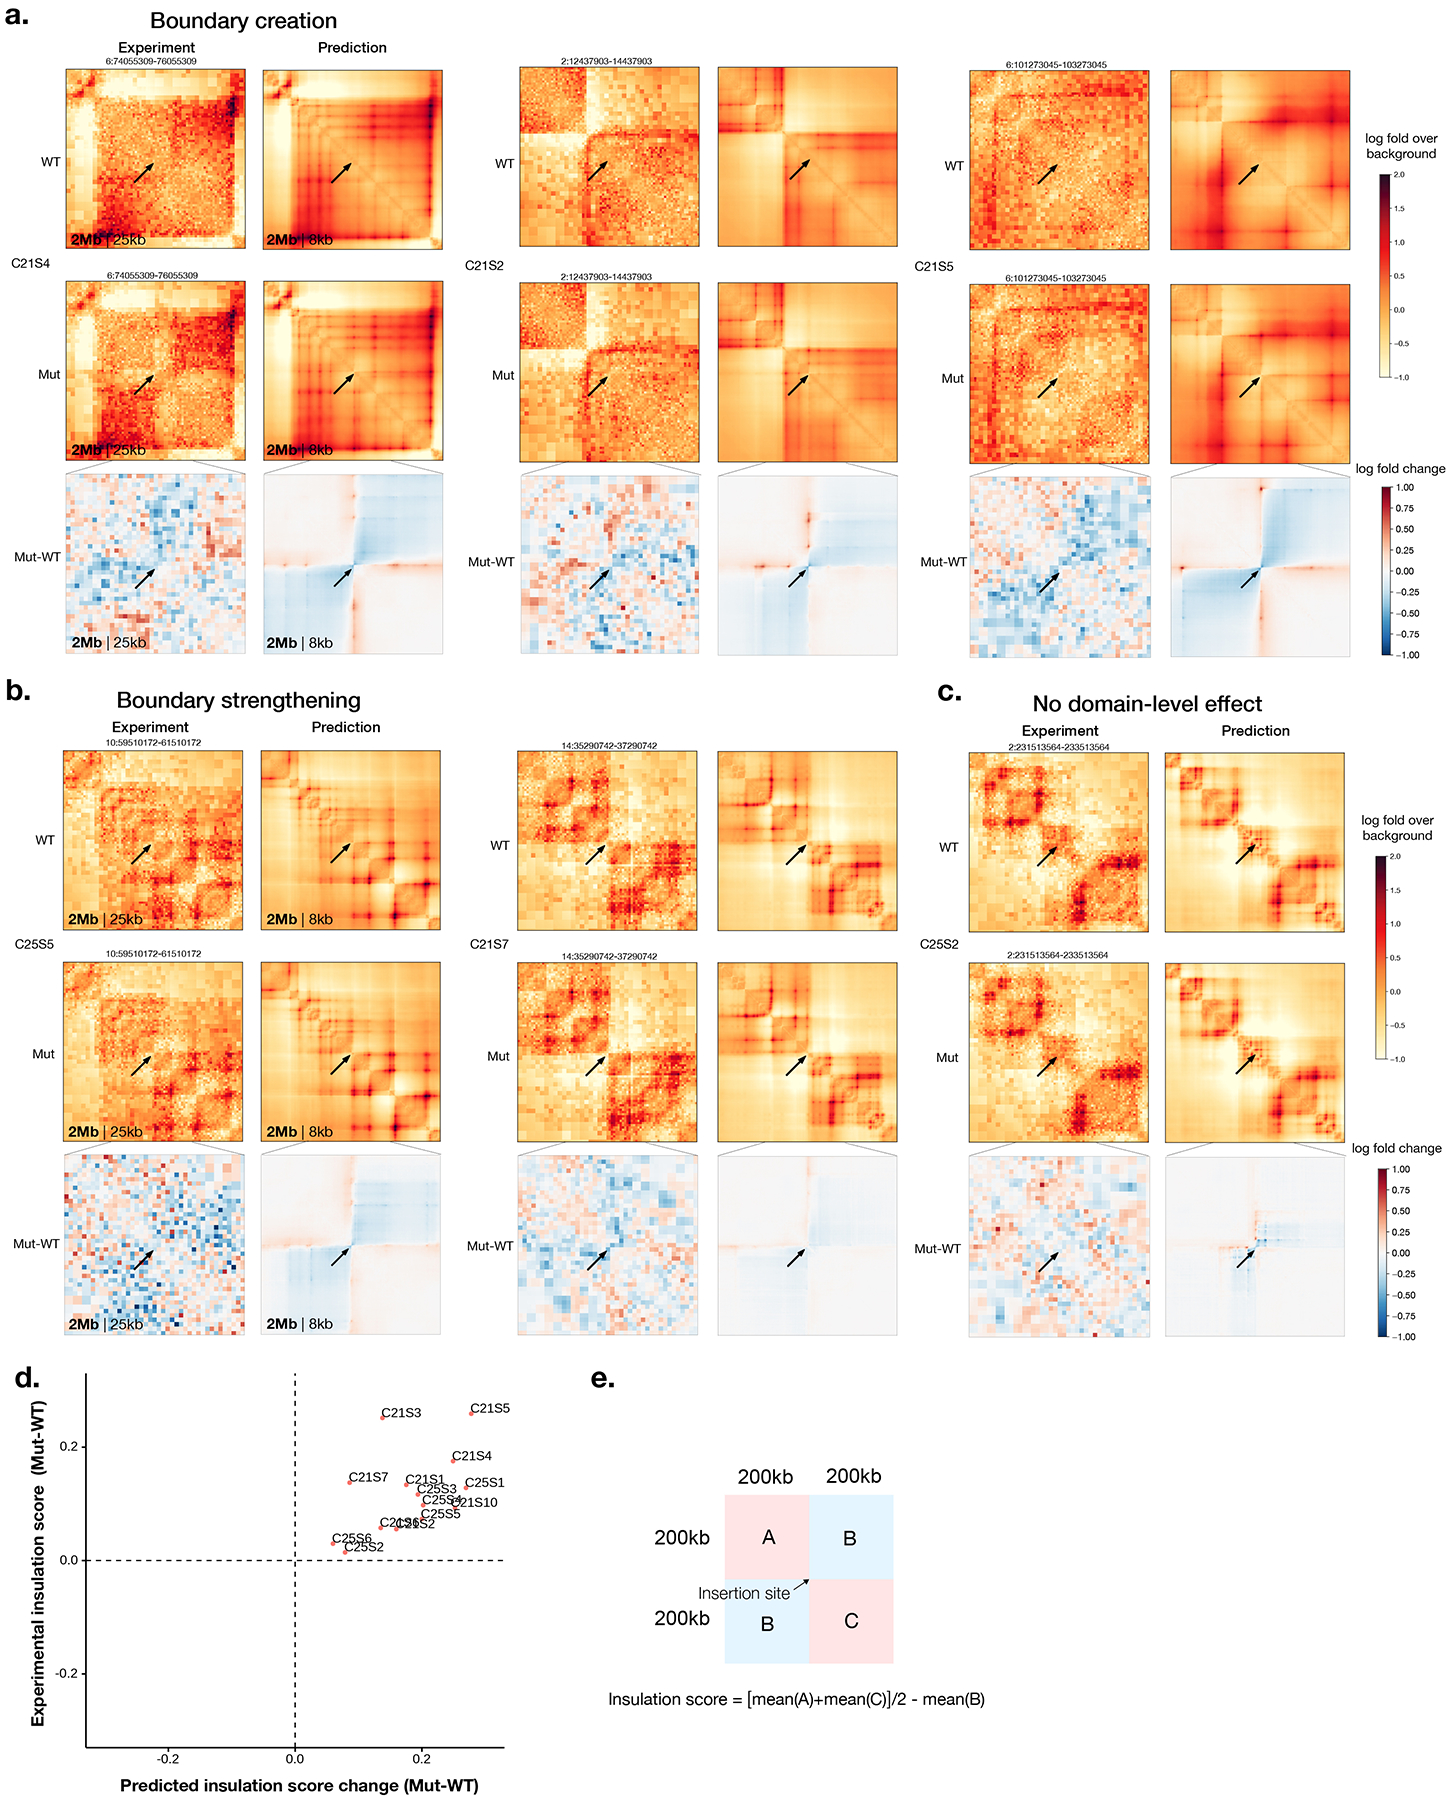
Extended Data Fig. 5. Visualized predictions of transposon-mediated boundary element insertion effects in multiple insertion sites.

All insertions with previously categorized effects (boundary creation, boundary strengthening, and no domain-level effect) in Zhang et al.24 are shown. The experimental measurements by in situ Hi-C in HAP1 cell is compared with H1-ESC model predictions. The genome interactions are represented by the log fold over genomic-distance-based background scores for both prediction and experimental data. Arrows indicate the insertion sites. The genome coordinates are in hg19.
