Figure 4.

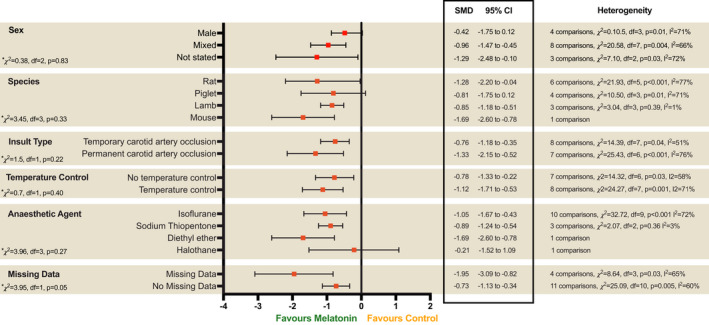
Subgroup analysis to assess the influence of study characteristics. Forest plots of SMD with 95% CI. Test of subgroup differences where p > 0.1 represents statistical significance.

Subgroup analysis to assess the influence of study characteristics. Forest plots of SMD with 95% CI. Test of subgroup differences where p > 0.1 represents statistical significance.