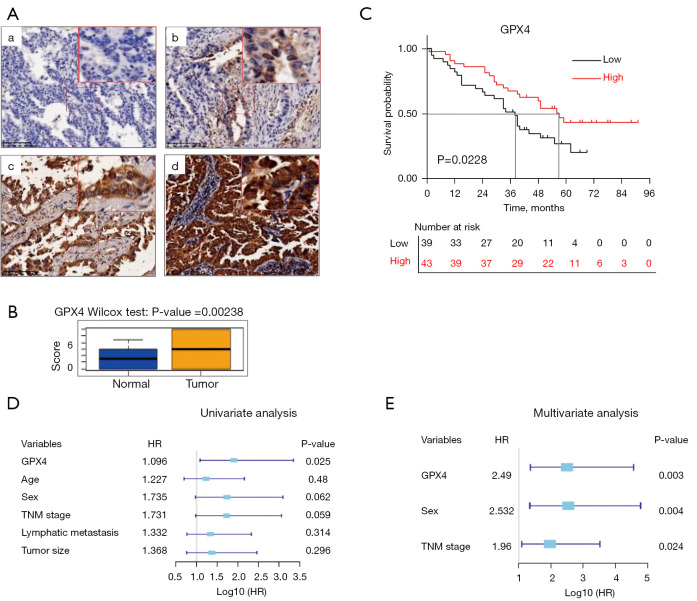
Figure 4.
Correlation between GPX4 expression and the survival of patients based on the LUAD tissue microarray. (A) Representative images of different immunohistochemical staining intensities of GPX4 in the LUAD tissue microarray: (a) negative staining; (b) weak staining; (c) moderate staining; (d) strong staining. Scale bar =200 µm. (B) Different GPX4 expression between LUADs and normal lung tissues. Cox regression analysis of GPX4 in LUADs from the tissue microarray. (C) The Kaplan-Meier survival curve showed that LUAD patients with low GPX4 expression had an unfavorable OS (P=0.0228). (D) Univariate analysis. (E) Multivariate analysis. High, high expression; Low, low expression; HR, hazard ratio.

