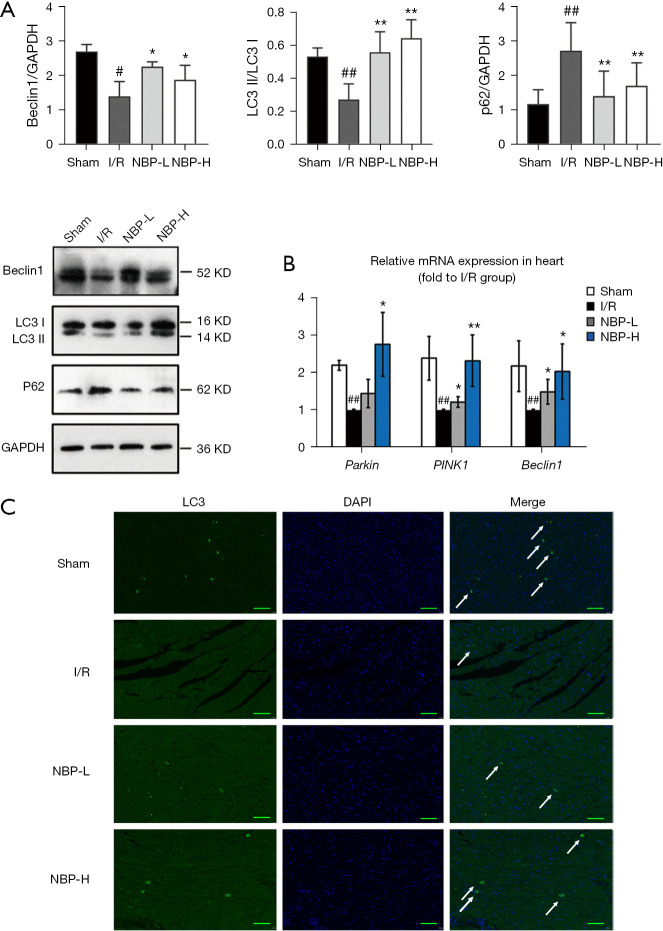
Figure 4.
NBP promoted autophagy in rats subjected to I/R injury. (A) Western blot analysis of the expression levels of autophagy-related proteins (Beclin1, LC3 II/LC3 I, and p62) in heart tissue. (B) RT-PCR detection of gene expression levels in rat heart tissue. (C) Representative images of immunofluorescence labelling with LC3 in different groups. Scale bar =50 µm. The white arrow indicates the expression of LC3. ##, indicates P<0.01 compared with the sham group; #, indicates P<0.05 compared with the sham group; **, indicates P<0.01 compared with the I/R group; *, indicates P<0.05 compared with the I/R group. I/R, ischemia/reperfusion; NBP, Dl-3-n-butylphthalide; NBP-L, low dose of NBP; NBP-H, high dose of NBP; GAPDH, glyceraldehyde 3-phosphate dehydrogenase; LC3, light chain 3; DAPI, 4',6-diamidino-2-phenylindole; RT-PCR, reverse transcription polymerase chain reaction.

