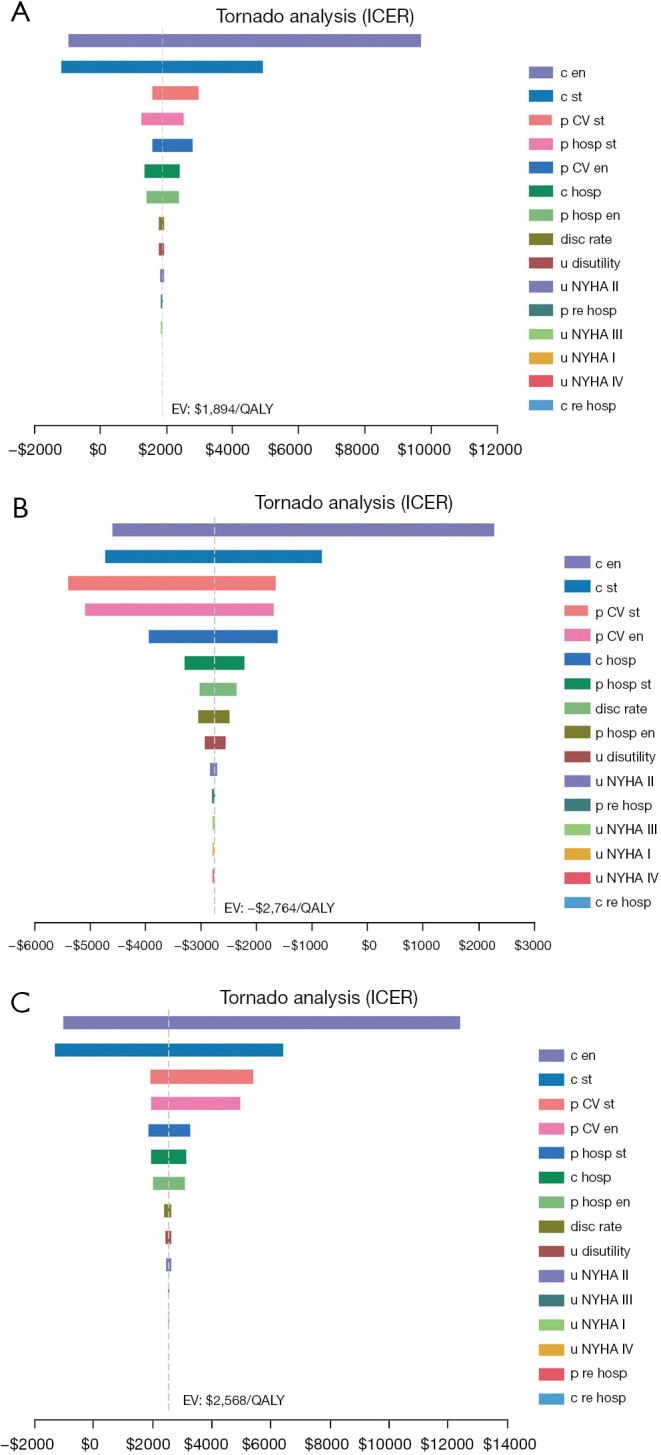
Figure 1.

Tornado diagrams of the univariable sensitivity analysis. The results of the ICER of the empagliflozin group vs. the control group for different populations: (A) total population; (B) those with diabetes; (C) those without diabetes. CV, cardiovascular; EV, expected value; QALYs, quality-adjusted life years; ICER, incremental cost-effectiveness ratio; c en, cost of empagliflozin; c st, cost of standard treatment; p CV st, probability of cardiovascular mortality for control group; p hosp st, probability of hospitalization for control group; p CV en, probability of cardiovascular mortality for empagliflozin group; c hosp, cost of hospitalization; p hosp en, probability of hospitalization for empagliflozin group; disc rate, discount rate; u disutility, value of disutility; u NYHA II, utility for New York Heart Association class II; p re hosp, probability of rehospitalization; u NYHA III, utility for New York Heart Association class III; u NYHA I, utility for New York Heart Association class I; u NYHA IV, utility for New York Heart Association class IV; c re hosp, cost of rehospitalization.
