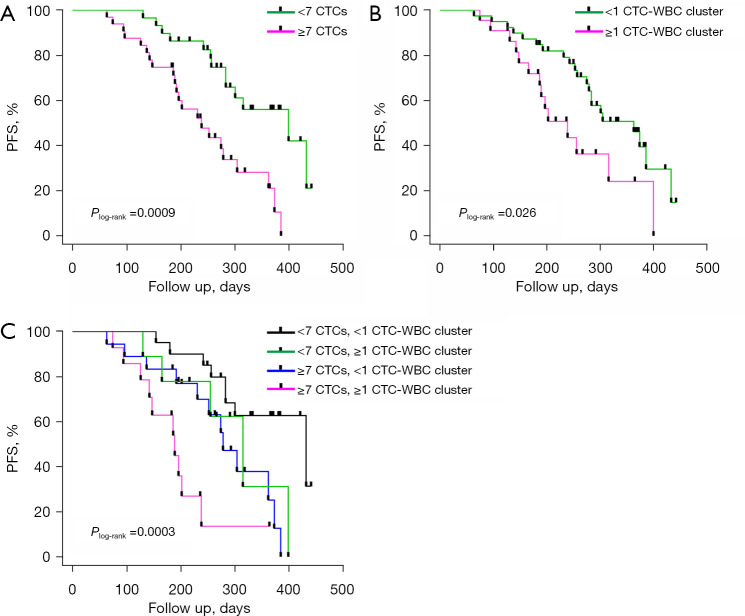
Figure 2.
Analysis of CTC counts and CTC-WBC clusters with patient PFS. (A) Kaplan-Meier curves showing the difference in PFS between the high-CTC (≥7 CTCs/6 mL) and low-CTC (<7 CTCs/6 mL) groups. (B) PFS analysis between CTC-WBC-cluster positive (≥1) and negative (<1) groups. (C) Combined analysis of CTCs and CTC-WBC clusters with patient PFS. Kaplan-Meier curves displaying the PFS of patients with <7 CTCs without CTC-WBC clusters, patients with <7 CTCs with CTC-WBC clusters, patients with ≥7 CTCs without CTC-WBC clusters, and patients with ≥7 CTCs with CTC-WBC clusters. CTC, circulating tumor cell; CTC-WBC cluster, circulating tumor-cell-associated white blood cell cluster; PFS, progression-free survival.

