Figure 4.
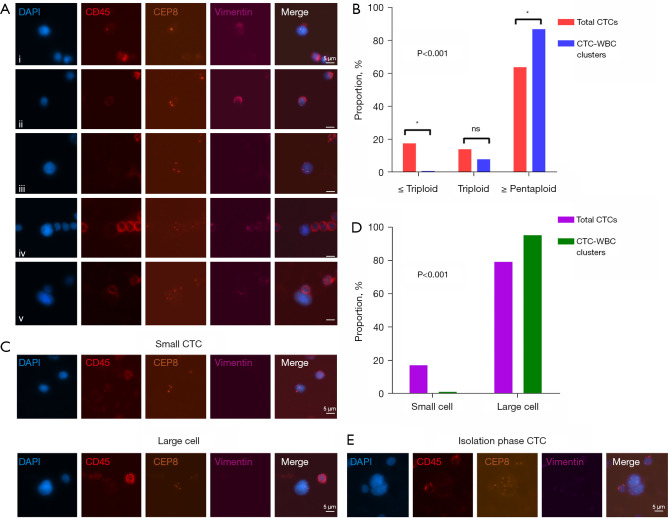
Characteristics analysis of CTCs in CTC-WBC clusters. (A) Schematic diagram of CTC chromosome ploidy detected by Subtraction Enrichment-iFISH platform. i–v representCTCs with haploid, diploid, triploid, tetraploid, and ≥ pentaploid Chr8, respectively. (B) Histogram of CTC ploidy distribution difference in the total CTCs and CTC-WBC clusters (*, denotes P<0.05; ns, non-significant). (C) A typical image of small (<5 µm) and large (≥5 µm) CTCs detected by Subtraction Enrichment-iFISH platform. (D) Histogram of the ratio of large and small CTCs to the total CTCs and CTC-WBC clusters. (E) A CTC in a CTC-WBC cluster displays a dividing nucleus with an intact cell membrane. The scale bars are 5 µm. DAPI, 4,6-diamino-2-phenyl indole; CTC, circulating tumor cell; CTC-WBC cluster, circulating tumor-cell-associated white blood cell cluster; iFISH, immunostaining-fluorescence in situ hybridization.

