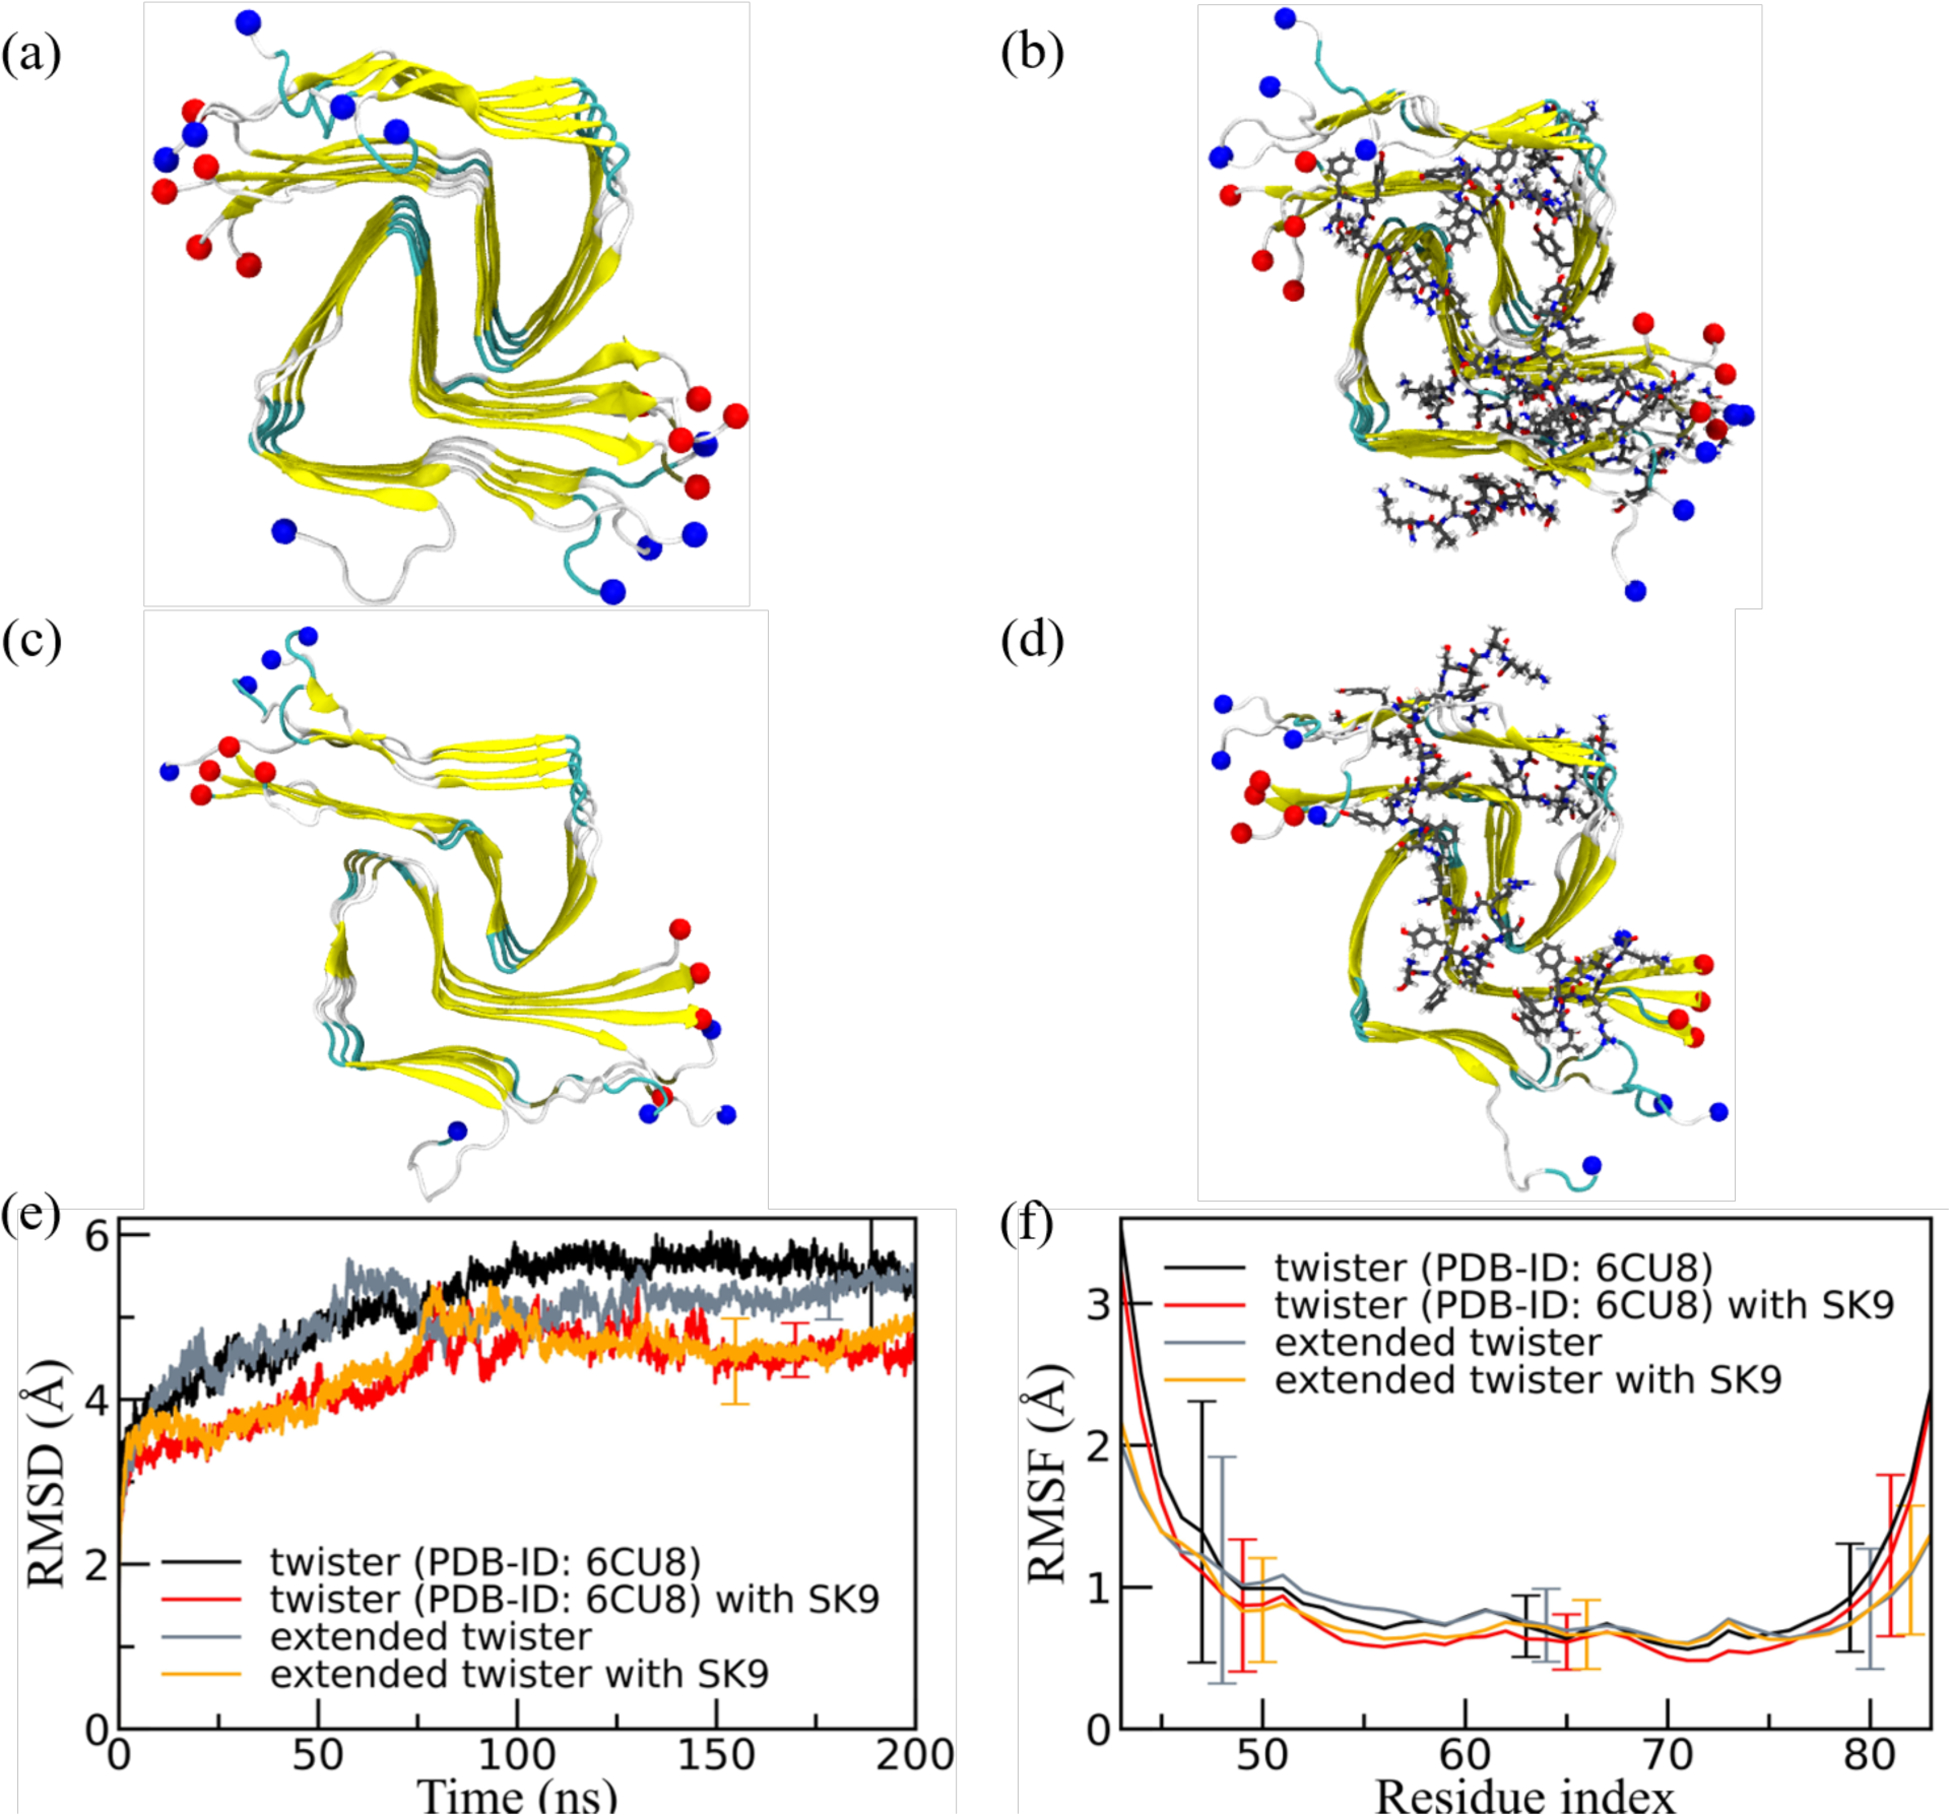
Figure 7:

Representative final configurations extracted from simulations starting from (a) the experimentally determined twister-like α-synuclein fibril model (PDB-ID: 6CU8) and (c) the extended model. Corresponding final snapshots extracted from simulations in the presence of SK9-segment are shown in (b), and (d). N- and C-terminus are represented by blue and red spheres, respectively. Only residues 43–83 are shown for the extended model configurations in (c) and(d). The time evolution of the RMSD in the simulation of these systems is shown in (e), and residue-wise RMSF in (f). We calculate RMSD and RMSF again only for the experimentally resolved region 43–83, i.e., ignoring the disordered and unresolved parts of the fibril models, considering all backbone atoms. Only a few typical error bars are shown to make figures more readable.
