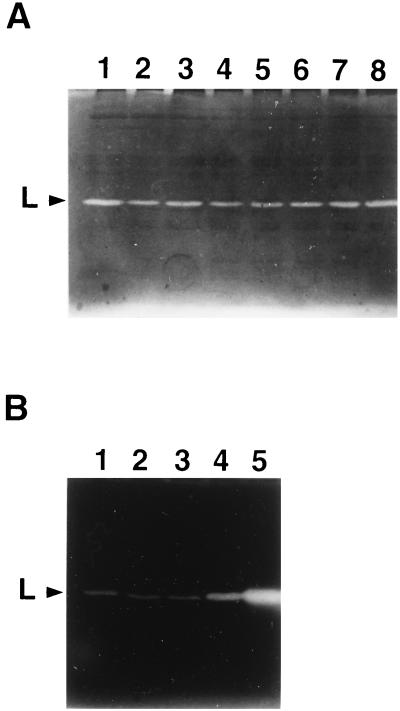
FIG. 6.
Effect of mitomycin C on the bacteriolytic activity profile of S. thermophilus DN-001065. During the experiment shown on Fig. 3, samples were removed from the untreated culture (A) and from the mitomycin C induced culture (B) after different times, and cell extracts were prepared with glass beads as described in Materials and Methods. The same protein amount of each cell extract was analyzed by renaturing SDS-PAGE. (A) Samples taken at zero time and at 10, 20, 30, 40, 50, 120, and 165 min (lanes 1 to 8, respectively) after the time of mitomycin C addition. (B) Samples taken at zero time and at 10, 20, 30, and 35 min (lanes 1 to 5, respectively) after mitomycin C addition. The position of bacteriolytic band L is indicated by an arrowhead.

