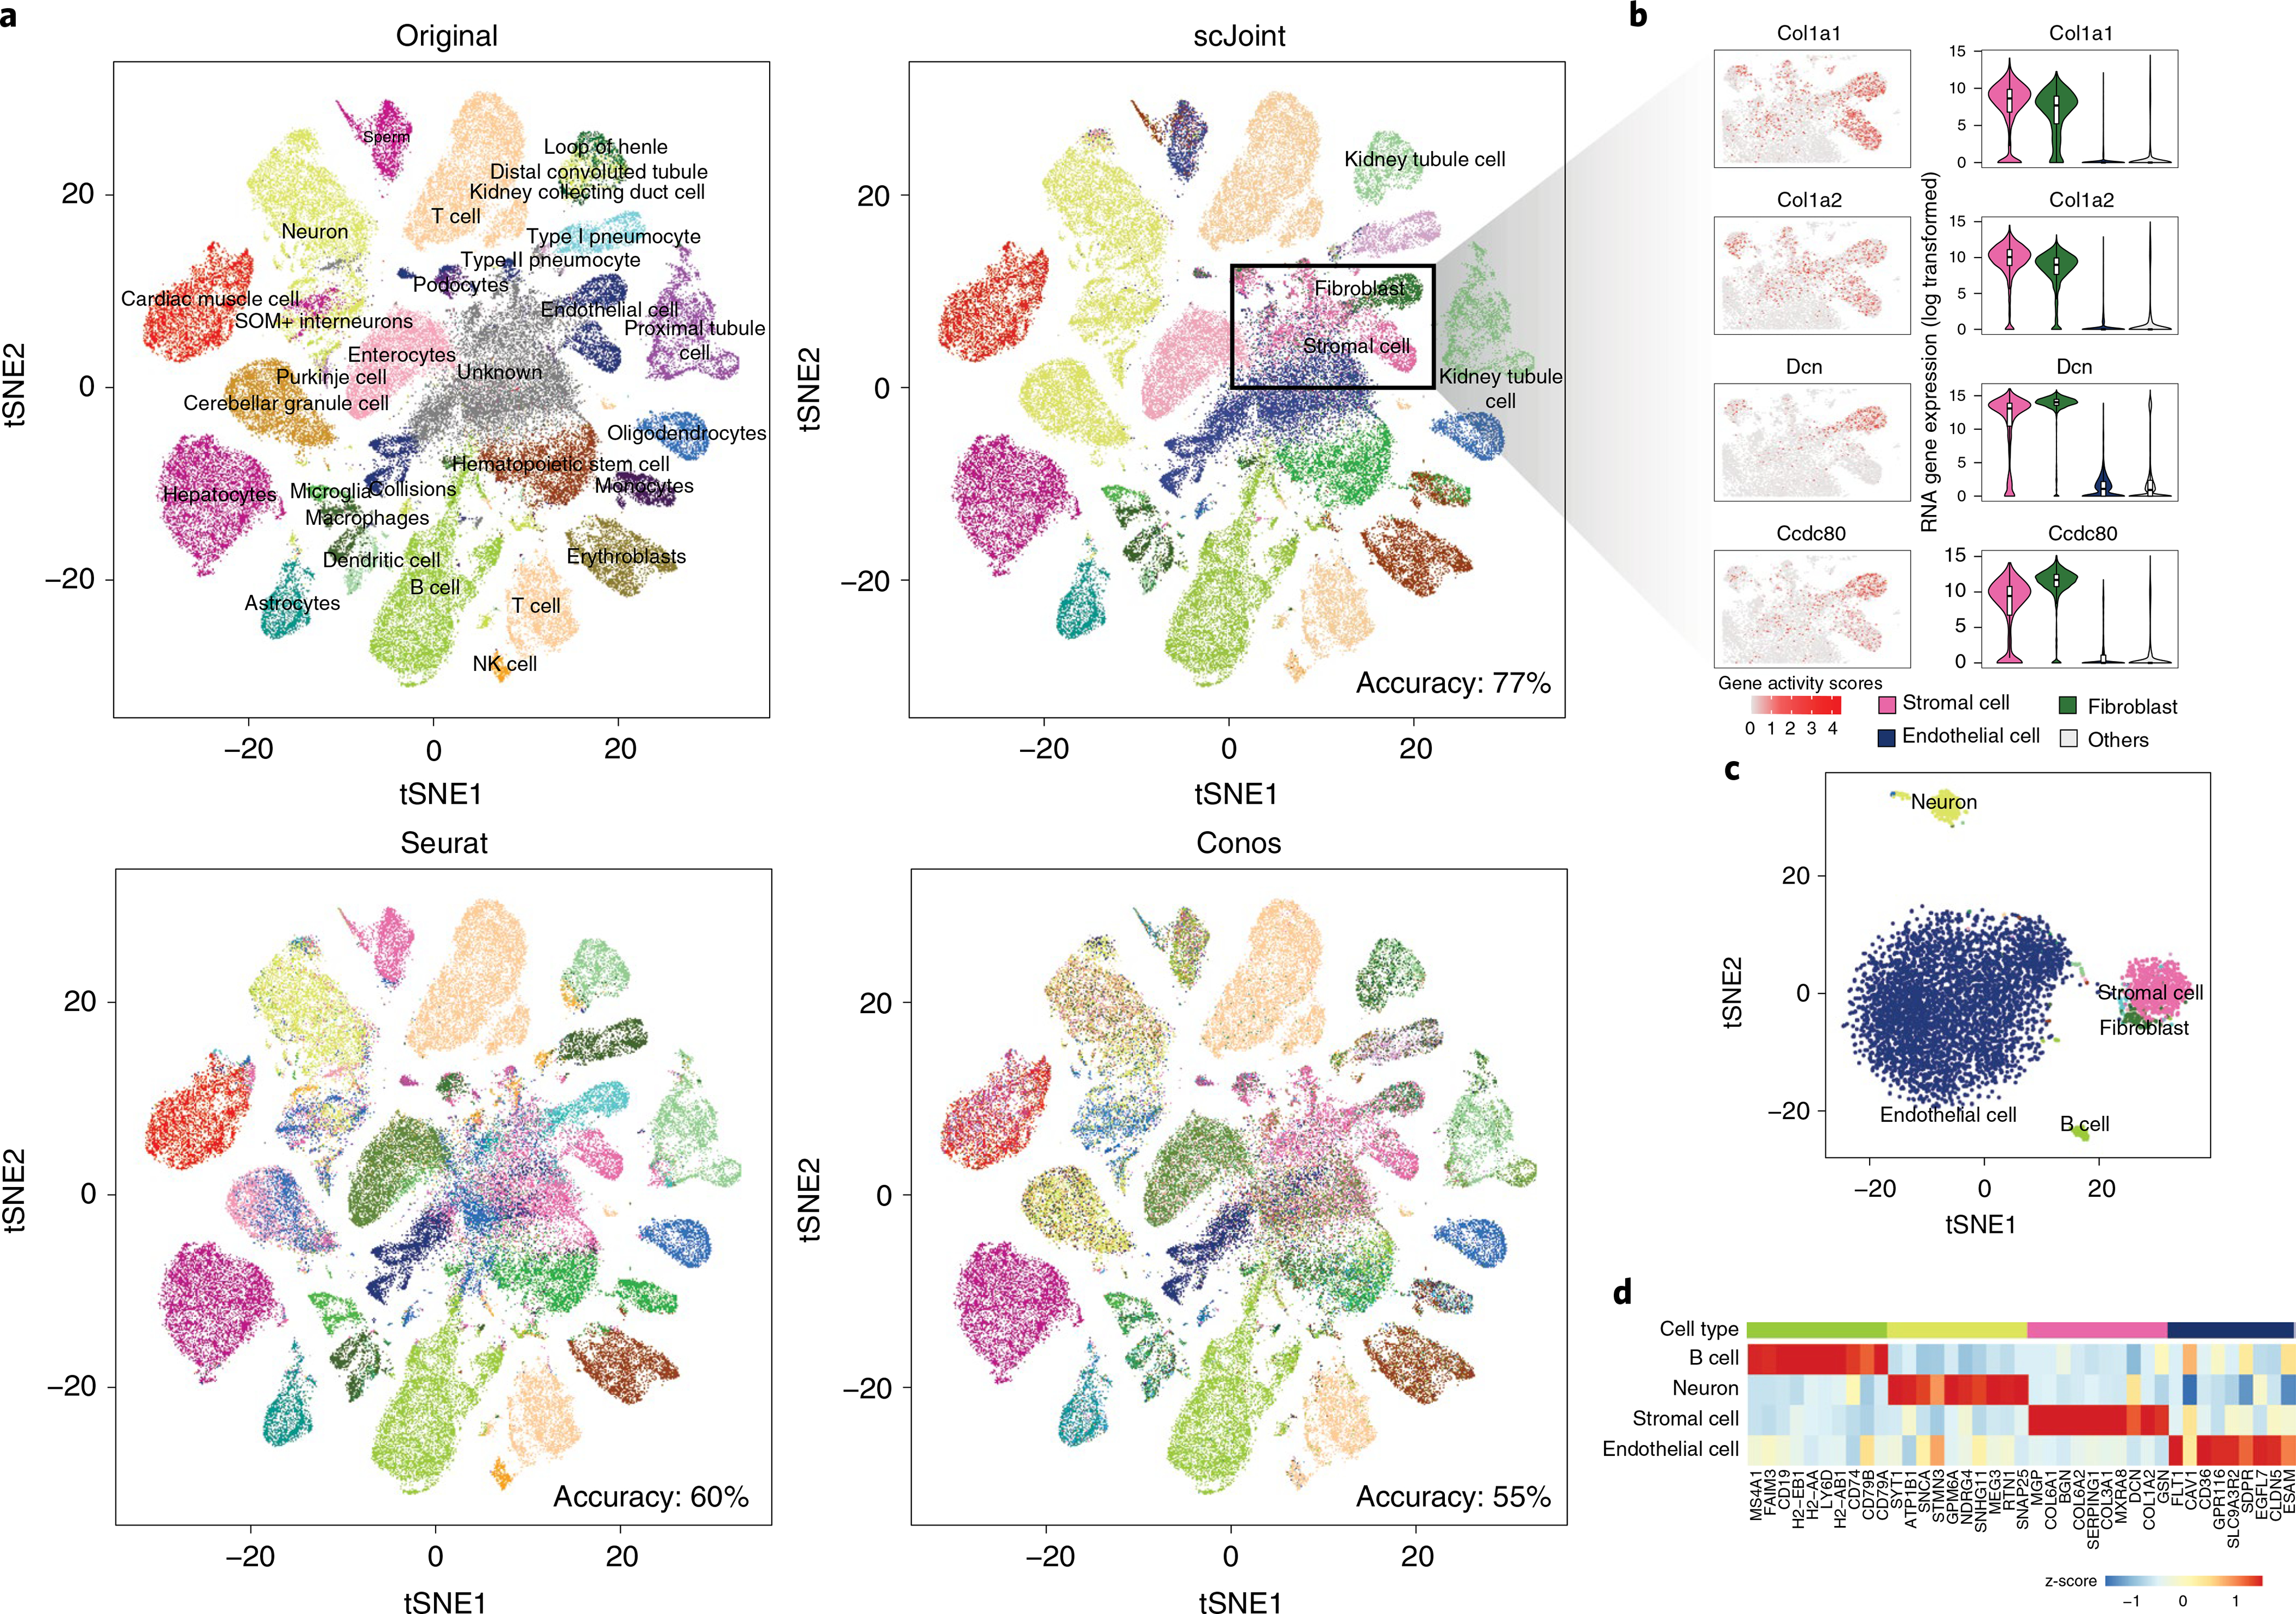
Fig. 3 |. Analysis of mouse cell atlas full data.

a, A 2 × 2 panel of tSNE plots generated from the top 100 dimensions of singular value decomposition of the TF-IDF transformed ATAC-seq data, colored by the original labels (top left), scJoint transferred labels (top right), Seurat transferred labels (bottom left) and Conos transferred labels (bottom right). b, Marker expressions in stromal cells and fibroblasts: Col1a1, Col1a2, Dcn and Ccdc80. The left column shows the gene activity scores of the markers in ATAC-seq data (4,352 stromal cells and 1,602 fibroblasts). The right column shows the log-transformed gene expression of the markers in stromal cells, fibroblasts and endothelial cells versus others; all cells here are taken from the FACS scRNA-seq data (n = 1,363, 2,152, 3,794 and 34,656 for stromal cells, fibroblasts, endothelial cells and others, respectively). Each boxplot ranges from the upper and lower quartiles with the median as the horizontal line and whiskers extend to 1.5 times the interquartile range. c, tSNE plot of cells originally labeled as ‘unknown’ and annotated by scJoint with probability scores greater than 0.80, colored by predicted cell types (5,931 cells). d, Heatmap of z-scores of average gene activity scores, calculated from cells aggregated by predicted cell types in ATAC. The rows indicate the top four predicted cell types by size. The columns indicate the top differential expressed genes of the corresponding cell type in RNA.
