Figure 3.
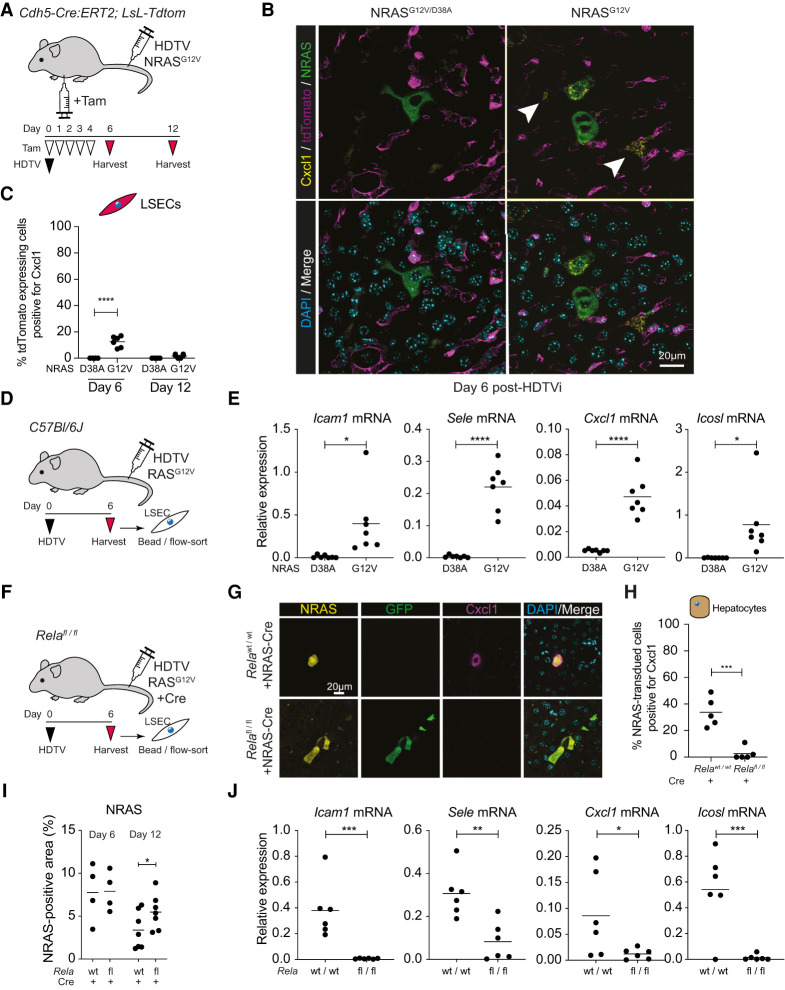
Senescent hepatocytes induce endothelial NF-κB signaling in vivo. (A) Experimental setup: Cdh5-Cre:ERT2; LoxP-STOP-LoxP-TdTomato endothelial reporter mice underwent hydrodynamic tail vein (HDTV) injection with transposons containing oncogenic NRASG12V or nonfunctional NRASG12V/D38A and then intraperitoneal injection with tamoxifen (Tam), leading to TdTomato expression in endothelial cells. (B) Representative immunofluorescence of liver sections from mice injected with the indicated constructs, showing Cxcl1 expression in TdTomato+ endothelial cells (arrowheads). Scale bar, 20 µm. (C) Quantification of Cxcl1-expressing TdTomato+ endothelial cells at the indicated time points. Dots are individual mice, and bars are means. Data were analyzed by unpaired Student's t-test; (****) P ≤ 0.0001. (D,E) Experimental setup: Wild-type mice were injected with oncogenic NRASG12V or nonfunctional NRASG12V/D38A before harvesting and sorting of LSECs at day 6 after HDTV injection (D) and qPCR analyses of the indicated gene expression (E). Dots are individual mice, and bars are means. Data were analyzed by unpaired Student's t-test; (*) P ≤ 0.05, (****) P ≤ 0.0001. (F) Experimental setup: Wild-type or Relafl/fl mice were injected with oncogenic NRASG12V >> Cre before harvesting at day 6 after HDTV injection. (G) Representative immunofluorescence of liver sections for the indicated proteins at day 6 after HDTV injection of NRASG12V >> Cre-recombinase, leading to RIS with autonomous Rela knockout and GFP expression. Scale bar, 20 µm. (H) Quantification of Cxcl1-expressing RIS hepatocytes in the indicated conditions. Dots are individual mice, and bars are means. Data were analyzed by unpaired Student's t-test; (***) P ≤ 0.001. (I) Quantification of NRAS+ tissue area in the indicated conditions. Dots are individual mice, and bars are means. Data were analyzed by unpaired Student's t-test; (*) P ≤ 0.05. (J) qPCR analyses of the indicated gene expression from LSECs at day 6 after HDTV injection. Dots are individual mice, and bars are means. Data were analyzed by unpaired Student's t-test; (*) P ≤ 0.05, (**) P ≤ 0.01, (***) P ≤ 0.001.

