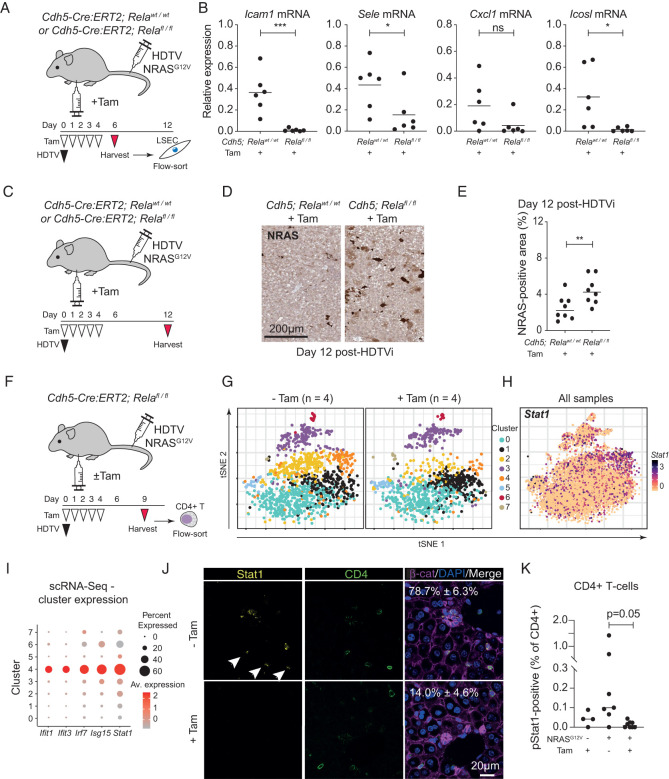
Figure 4.
Nonautonomous induction of endothelial NF-κB signaling regulates senescence surveillance and specific immunocyte recruitment. (A) Experimental setup: Cdh5-Cre:ERT2; Relafl/fl or Relawild-type (WT) mice underwent hydrodynamic tail vein (HDTV) injection with NRASG12V-containing transposons and then intraperitoneal injection with tamoxifen (Tam), leading to deletion of Rela in endothelial cells. (B) LSECs were harvested 6 d after HDTV injection and analyzed for the indicated gene expression by qPCR. Dots are individual mice, and bars are means. Data were analyzed by unpaired Student's t-test; (*) P ≤ 0.05, (***) P ≤ 0.001. (C) Experimental setup: Cdh5-Cre:ERT2; Relafl/fl or wild-type mice underwent hydrodynamic tail vein (HDTV) injection with transposons containing oncogenic NRASG12V and then intraperitoneal injection with tamoxifen (Tam) before harvesting at 12 d after HDTV injection and analysis of RIS hepatocytes by immunohistochemistry. (D,E) Representative photomicrographs of RAS immunochemistry from the indicated conditions (D; scale bar, 200 µm) with quantification (E). Dots are individual mice, and bars are means. Data were analyzed by unpaired Student's t-test; (**) P ≤ 0.01. (F) Experimental setup: Cdh5-Cre:ERT2; Relafl/fl mice underwent hydrodynamic tail vein (HDTV) injection with NRASG12V-containing transposons and intraperitoneal injection with tamoxifen (Tam) or vehicle control before harvesting at 9 d after HDTV injection. Intrahepatic CD4+ T lymphocytes were flow-sorted before droplet-based scRNA sequencing. (G,H) tSNE clustering of 8152 CD4+ T cells from four mice in each indicated condition, showing differential abundance of cells in different clusters (G) and log2 normalized Stat1 expression across all eight mice (H). (I) Expression plot showing cluster-specific expression of the indicated interferon-stimulated genes in the indicated CD4+ T-cell clusters from scRNA-seq data. (J) Representative immunofluorescence of liver sections from mice (as in F) injected with the indicated constructs, showing Stat1 expression in CD4+ cells (arrowheads). Scale bar, 20 µm. n = 3 biological replicates. (K) Flow cytometric analysis of Stat1 phosphorylation at Ser727 in intrahepatic CD4+ T lymphocytes in the indicated conditions. Dots are individual mice, and bars are means. Data were analyzed by one-way ANOVA with Sidak's multiple comparisons test.

