Figure 2.
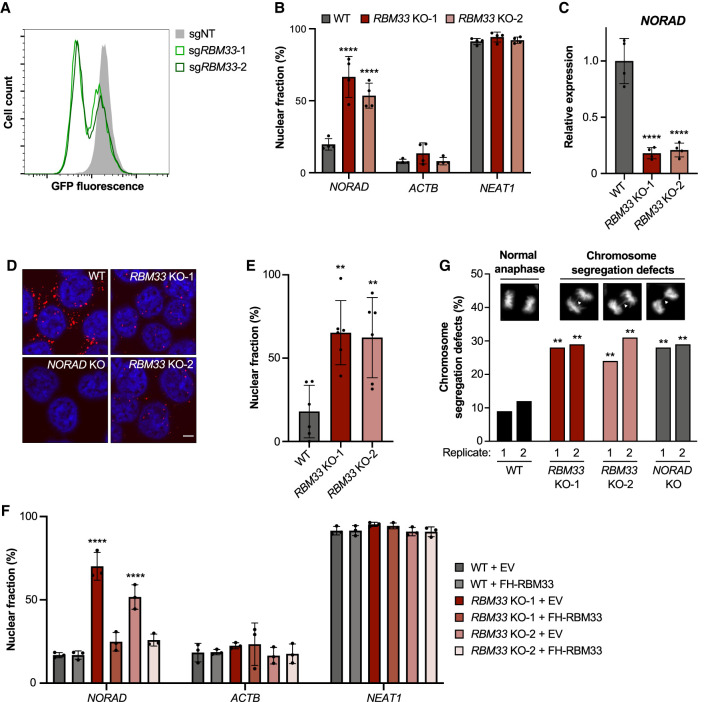
Loss of RBM33 results in nuclear enrichment and decreased abundance of NORAD. (A) Flow cytometry analysis of GFP expression in NORAD reporter cells following lentiviral delivery of Cas9 and nontarget (NT) control sgRNA or two independent sgRNAs targeting RBM33. (B,C) qRT-PCR analysis of the fraction of NORAD, ACTB, and NEAT1 in the nucleus (B) or NORAD expression relative to 18S rRNA (C) in WT and RBM33 KO HCT116 clones. (D) NORAD RNA FISH in HCT116 cells of the indicated genotypes. (Red) NORAD FISH, (blue) DAPI. Scale bar, 5 µm. (E) Quantification of the percentage of nuclear-localized NORAD FISH signal. Each data point represents a field containing at least 20 cells. (F) qRT-PCR analysis of the fraction of NORAD, ACTB, and NEAT1 in the nucleus of WT and RBM33 KO clones following lentiviral expression of FLAG-HA-RBM33 (FH-RBM33) or empty vector (EV) control. (G) Analysis of mitotic segregation defects in cells of the indicated genotypes. The inset shows representative images of anaphase cells with normal and defective chromosome segregation in DAPI-stained RBM33 KO-2 cells. qRT-PCR and FISH data are represented as mean ± SD with individual data points shown. For qRT-PCR experiments, n = 3–4 biological replicates, and P-values were calculated by one-way ANOVA (C,E) or two-way ANOVA (B,F) comparing RBM33 KO clones with WT (B,C,E) or each condition with WT + EV (F). For G, P-values were calculated by χ2 test comparing all replicate 1 samples with WT replicate 1 and all replicate 2 samples with WT replicate 2. (**) P ≤ 0.01, (****) P ≤ 0.0001.

