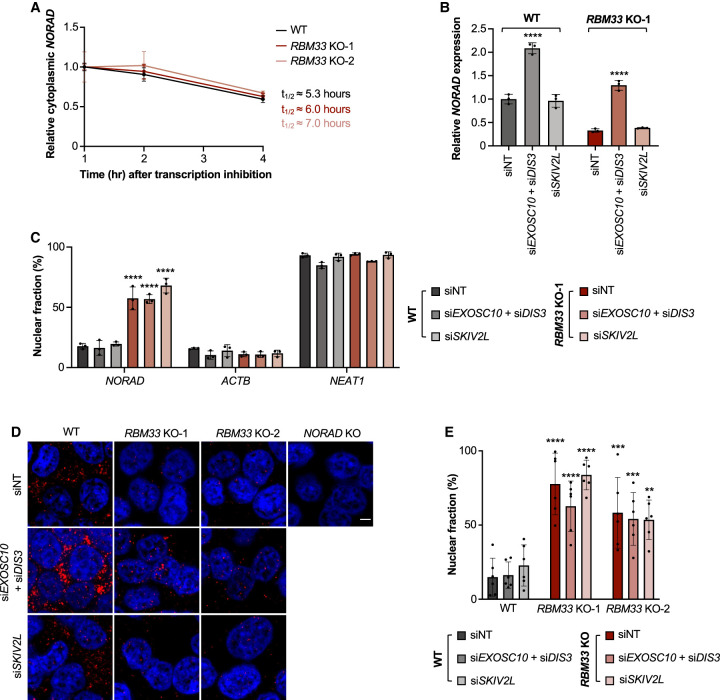
Figure 3.
Loss of RBM33 impairs NORAD nuclear export, resulting in degradation by the nuclear exosome. (A) qRT-PCR analysis of NORAD cytoplasmic decay rates in HCT116 cells of the indicated genotypes. NORAD levels were normalized to ACTB abundance at each time point. (B) qRT-PCR analysis of NORAD expression relative to 18S rRNA in WT and RBM33 KO-1 cells transfected with the indicated siRNA Smartpools. P-values were calculated by one-way ANOVA comparing each condition with nontarget (NT) siRNA in the same genotype. (C) The fraction of NORAD, ACTB, and NEAT1 in the nucleus in WT and RBM33 KO-1 cells transfected with the indicated siRNA Smartpools. P-values were calculated by two-way ANOVA comparing each condition with siNT in WT cells. (D) NORAD RNA FISH in HCT116 cells of the indicated genotypes transfected with the indicated siRNA Smartpools. (Red) NORAD FISH, (blue) DAPI. Scale bar, 5 µm. (E) Quantification of the percentage of nuclear-localized NORAD FISH signal. Each data point represents a field containing at least 20 cells. Data are represented as mean ± SD with individual data points shown. P-values were calculated by one-way ANOVA comparing each condition with WT transfected with siNT. For qRT-PCR experiments, n = 3 biological replicates. (**) P ≤ 0.01, (***) P ≤ 0.001, (****) P ≤ 0.0001.

