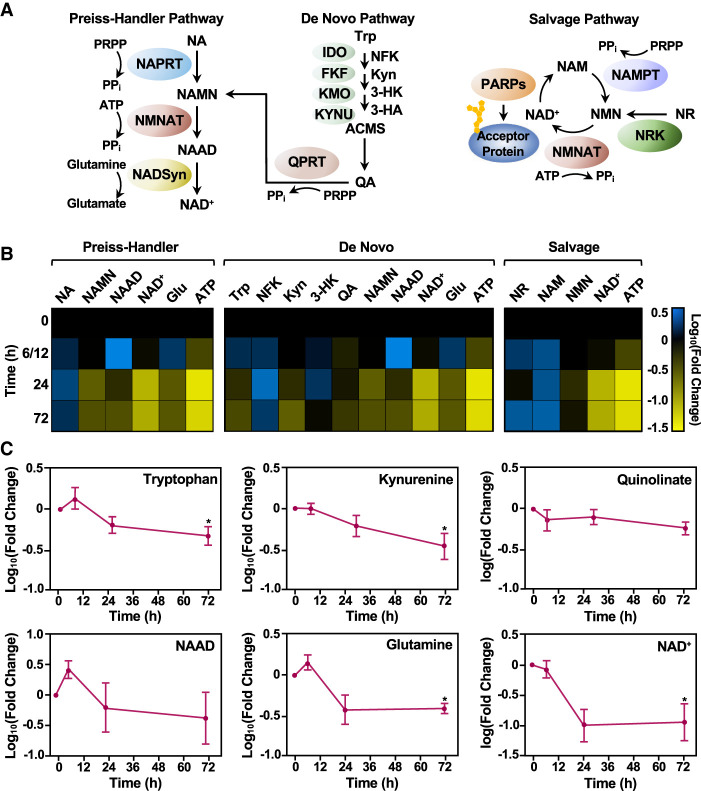
Figure 2.
Different NAD+ biosynthetic pathways are used in distinct mESC states. (A) Schematic representation of the three major NAD+ biosynthesis pathways (Preiss–Handler, de novo, and salvage), including the metabolites in the pathway and the enzymes that catalyze each step. Enzymes are represented as colored ovals. (NA) Nicotinic acid, (NAMN) nicotinic acid mononucleotide, (NAAD) nicotinic acid adenine dinucleotide, (Trp) tryptophan, (NFK) N-formyl-kynurenine, (Kyn) kynurenine, (3-HK) 3-hydroxykynurenine, (3-HA) 3-hydroxyanthranilate, (QA) quinolinate, (NAM) nicotinamide, (NR) nicotinamide riboside, (NMN) nicotinamide mononucleotide, (NAD+) nicotinamide adenine dinucleotide, (PRPP) phosphoribosyl pyrophosphate, (Glu) glutamine, (ATP) adenosine triphosphate. (B) Heat map representation of the relative levels of metabolites in the NAD+ biosynthetic pathways in WT mESCs during a time course of differentiation as determined by mass spectrometry. Each column represents a single metabolite throughout time course, and each row represents the time points (the data for the 6- and 12-h time points were combined). Metabolites that increased relative to the 0-h time point are represented in blue (log10 fold change [FC]), and metabolites that decreased in abundance are indicated in yellow. Metabolites are grouped and ordered according to the NAD+ metabolic pathways (Preiss–Handler, de novo, and salvage), as indicated. (C) Line plot representation of average relative levels (log10FC) of key metabolites in the de novo pathway (n = 7; ANOVA). (∗) P < 0.05.

