
FIG. 3.
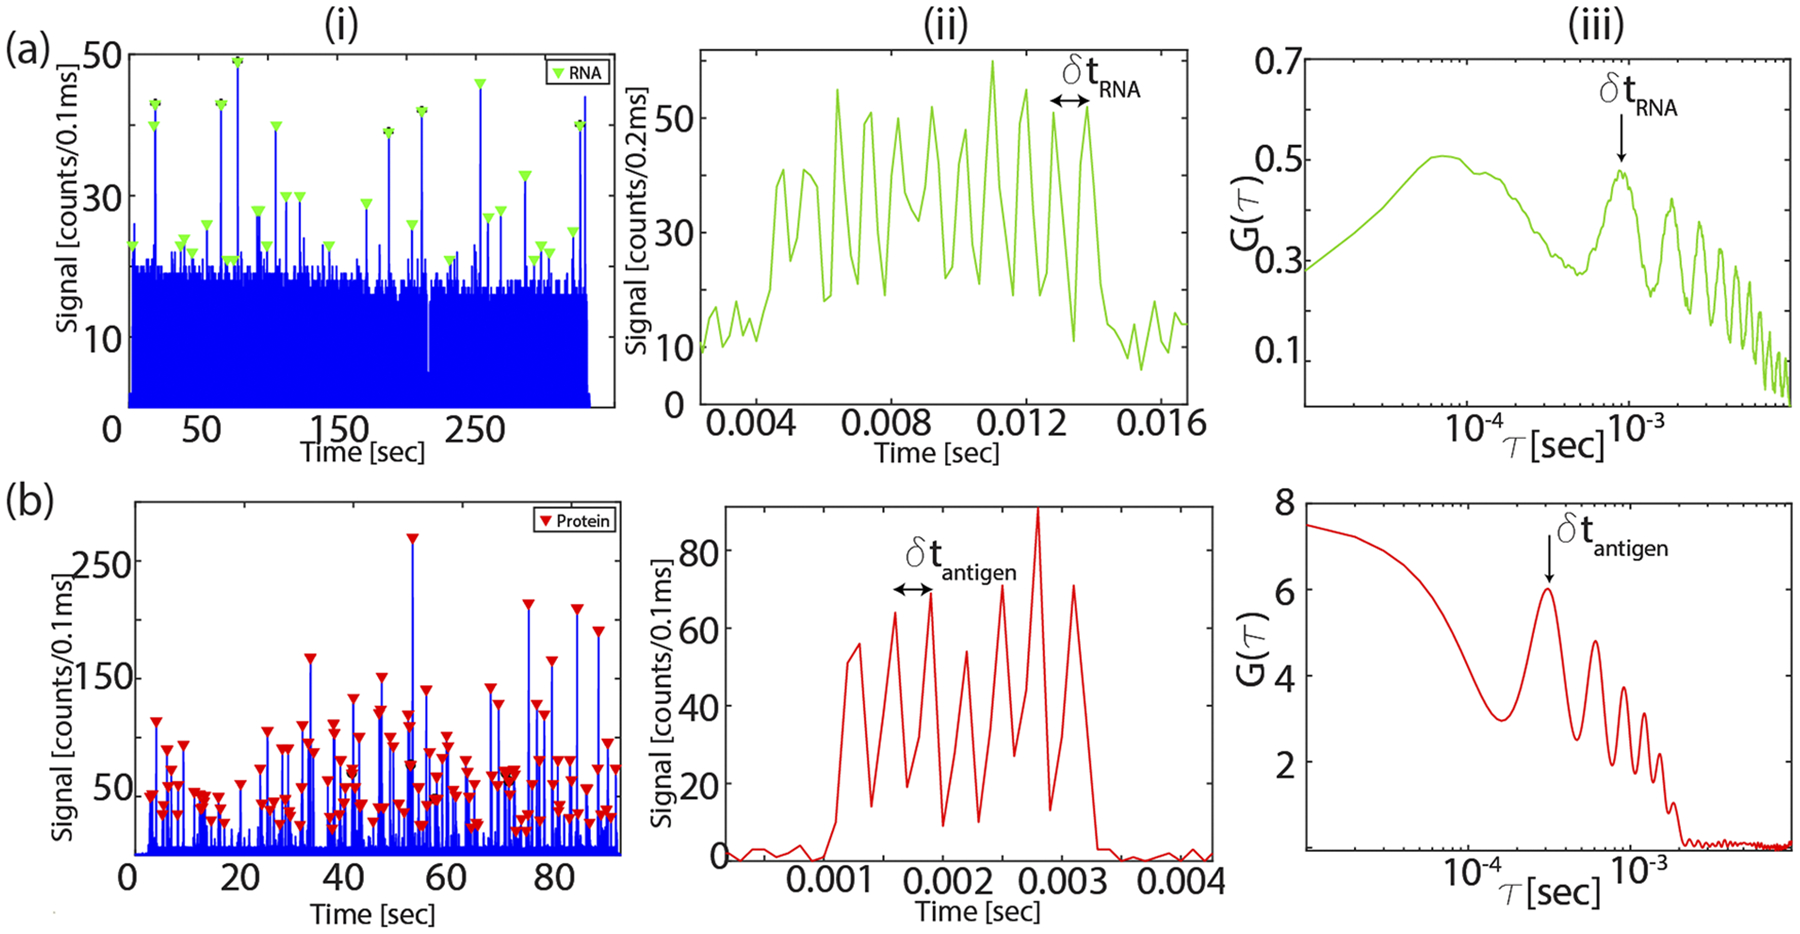
Fluorescence signal: (a) single RNA detection: i—fluorescence signals from RNA molecules flowed through LC1 and excited by the MMI waveguide coupled to 556 nm laser, ii—zoomed-in signal from a single RNA with 11 peaks, and iii—corresponding single RNA autocorrelation signal. The peak number depends on the excitation pattern and gives the characteristic time δt of the target. (b) Same analysis for single antigen target detection using the seven-spot pattern in LC2.