
FIG. 4.
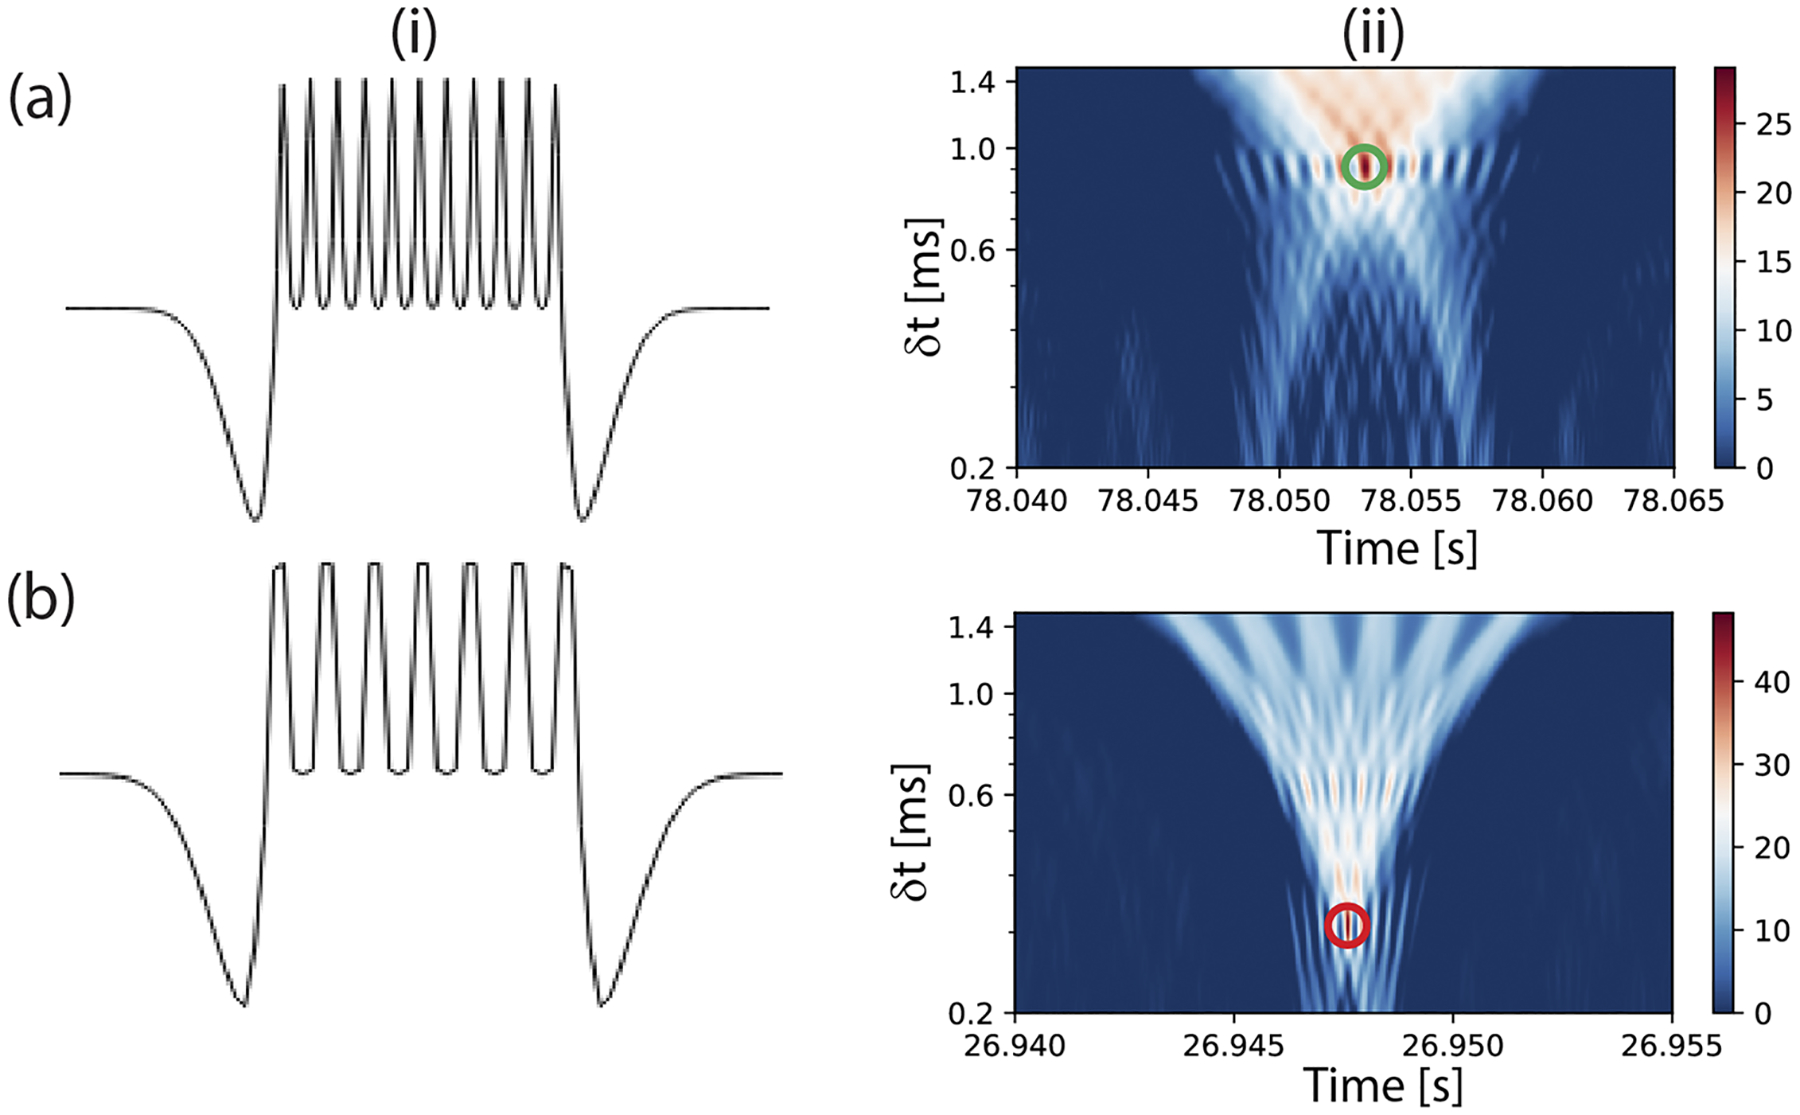
CWT analysis: (a) CWT analysis for RNA signal processing: i—custom wavelet function with 11 Gaussian peaks margined with negatively skewed peaks to analyze fluorescence signals from RNA targets and ii—example of a 2D map of the CWT coefficients [Eq. (3)] obtained when a signal from the RNA target [Fig. 3(a–iii)] is transformed with the corresponding wavelet function. The green circle indicates the presence of a local maximum. (b) The wavelet function for analyzing signals from proteins and an example of the CWT coefficients from processing an event [Fig. 3(b–iii)].