
Extended Data Fig. 3 |. PTG-KO does not affect the response to CL-316,243.
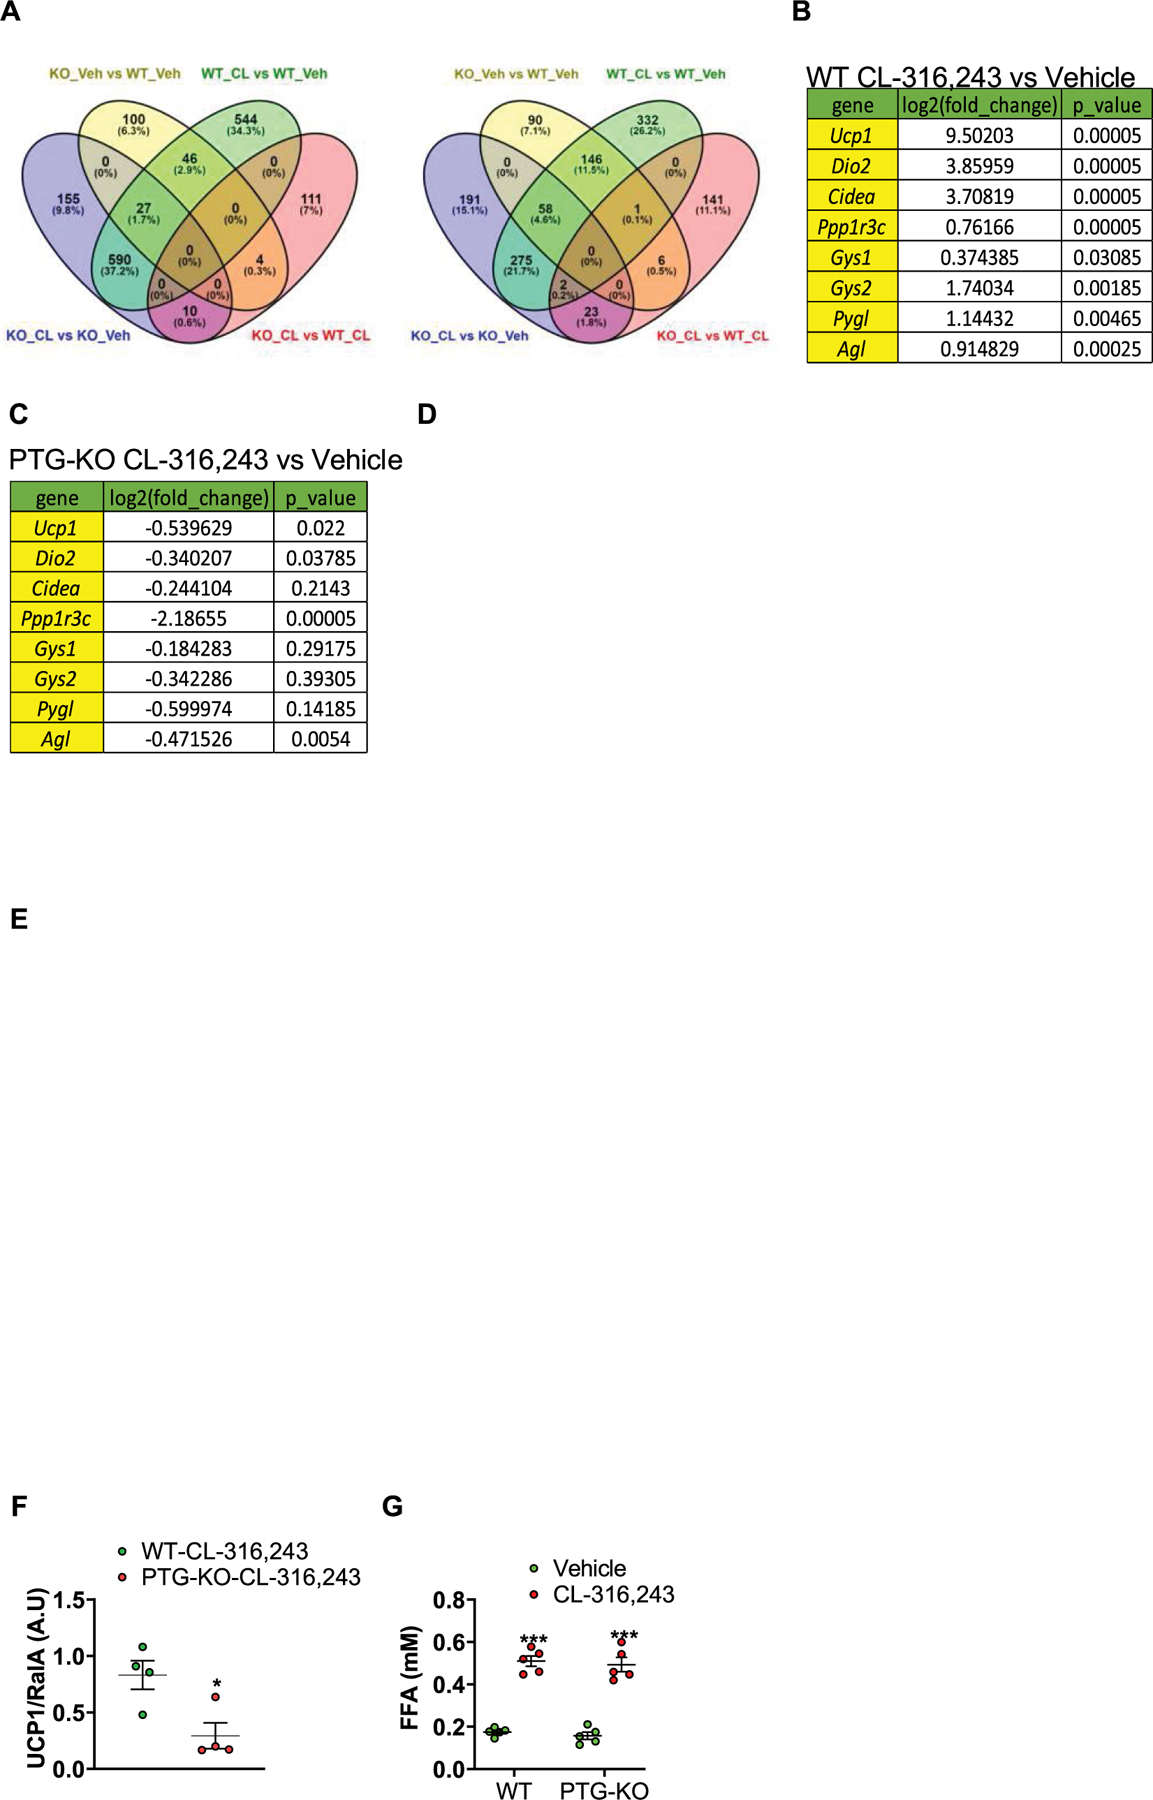
a-e, RNAseq data from iWAT-derived mature adipocytes of WT and PTG-KO mice treated with either vehicle or CL-316,243, n =3. a, Differential gene expression analyses of RNAseq data. b, Log2 of fold change of gene expression of CL-316,243 treated WT mice versus vehicle-treated WT mice. Statistical significance was determined using two-sided t-test. c, Log2 of fold change of gene expression of CL-316,243 treated PTG-KO mice versus vehicle treated PTG-KO mice. Statistical significance was determined using two-sided t-test. d, e, Pathway analyses of RNAseq were conducted using Gene Set Enrichment Analysis. f, Quantification of UCP1 protein expression data shown in Fig. 1f (main text), expression was normalized to RalA. n = 4 mice per treatment. Statistical significance was determined using two-sided t-test. g, Serum FFA levels in WT and PTG-KO mice treated with either vehicle or CL-316,243 for 20 min, n = 5 mice per genotype per treatment. Statistical significance was determined using two-way ANOVA with adjustments for multiple comparisons. Data are presented as mean ± s.e.m. *-p < 0.05. ***-p < 0.001. Accession number to cite these SRA data: PRJNA752350.