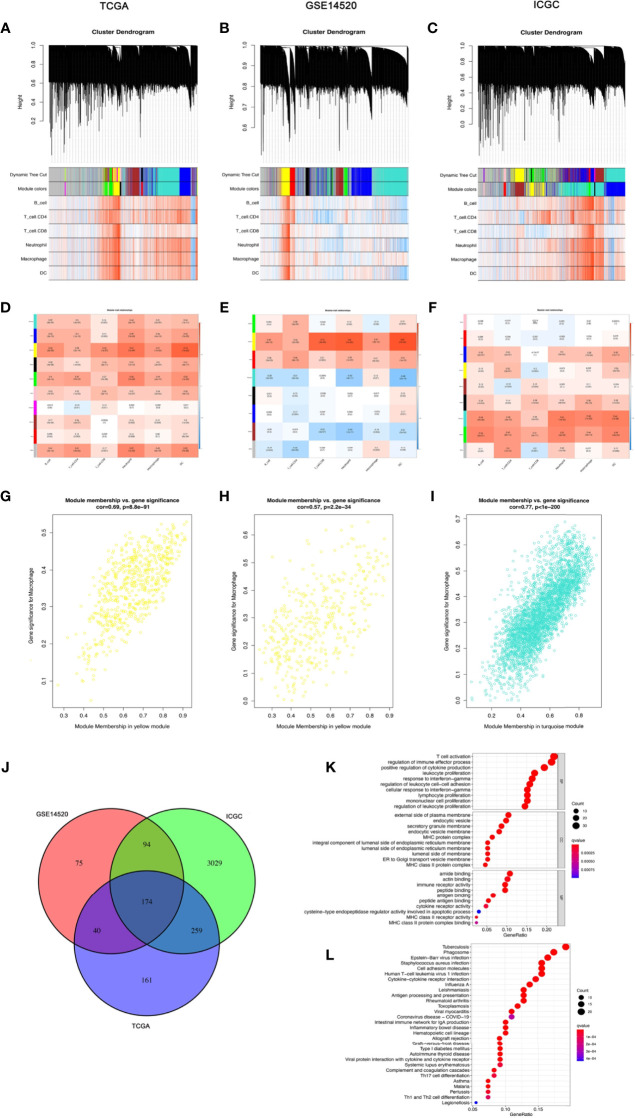
Figure 2.
The coexpression network established using weighted gene coexpression network analysis methods based on the (A) LIHC RNA-seq profiles from the TCGA-LIHC database, (B) GSE14520 dataset, and (C) the International Cancer Genome Consortium portal database. Heatmap demonstrating the correlation between module eigengenes and macrophages in the (D) TCGA-LIHC dataset, (E) GSE14520 dataset, and (F) International Cancer Genome Consortium portal dataset. (G) The yellow module had the strongest correlation with macrophage cell proportions in the TCGA-LIHC dataset (Cor = 0.69, P = 8.8e−91). (H) The yellow module had the strongest correlation with macrophage cell proportions in the GSE14520 cohort (Cor = 0.57, P = 2.2e−34). (I) The turquoise module had the strongest correlation with macrophage cell proportions in the ICGC (Cor = 0.77, P < 1e−200). (J) Venn diagram displaying the macrophage-related selected intersection genes from different datasets. (K, L) Gene ontology (GO) and Kyoto Encyclopedia of Genes and Genomes (KEGG) analyses of macrophage-related intersecting genes.

