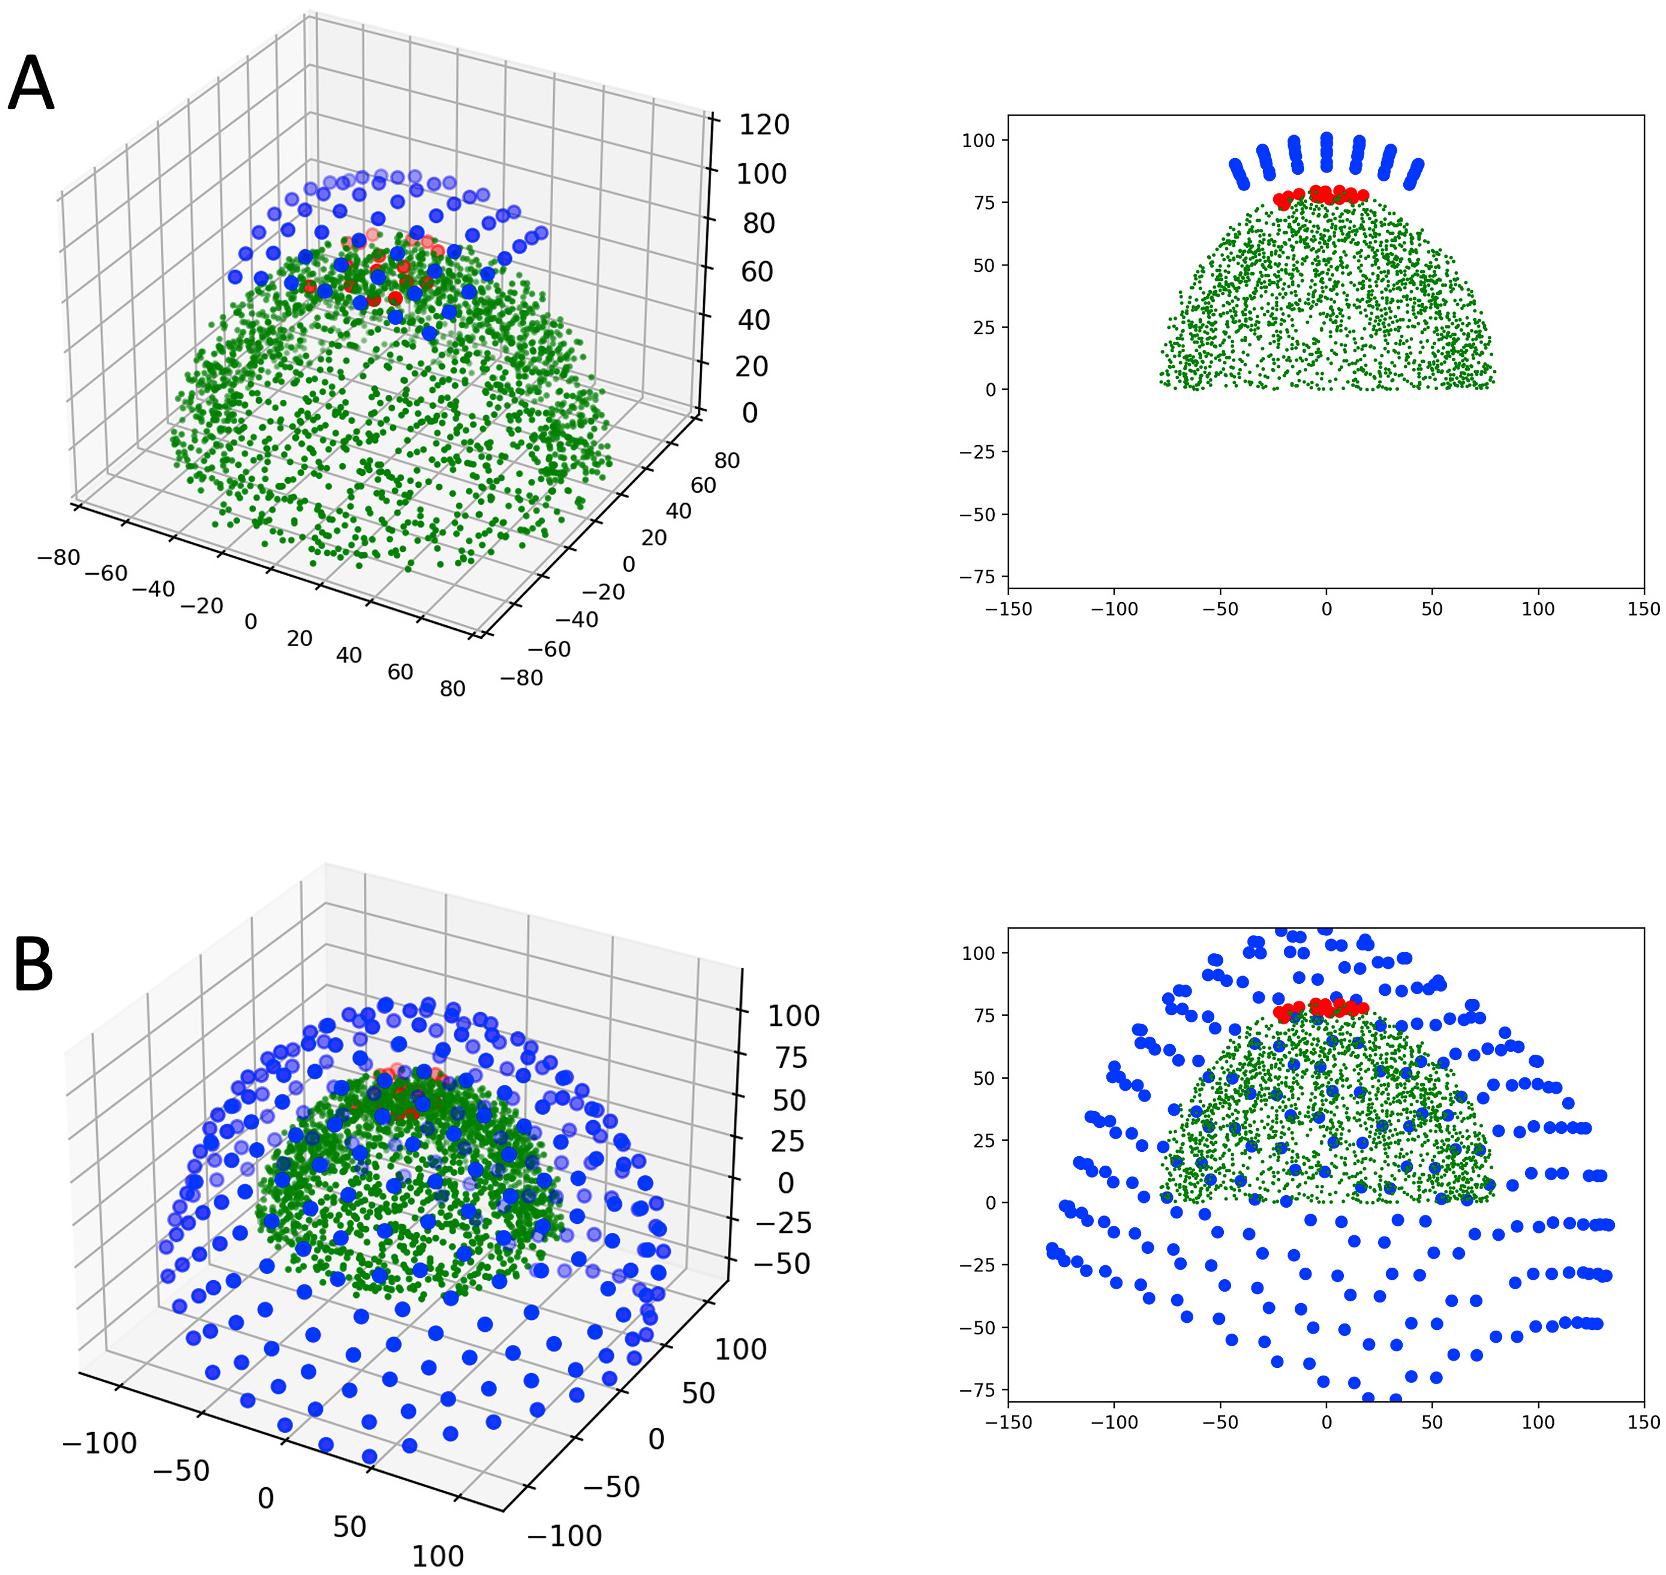
Fig. 1.

Illustration of the simulation geometry for the A) magnetocorticography array simulation and the B) CTF-275 simulation. Left panes illustrate the geometry in 3D while the right panes illustrate a projection onto the y-z plane. Scattered green dots represent the noise sources, while test sources and sensors are depicted in red and blue, respectively. (For interpretation of the references to colour in this figure legend, the reader is referred to the Web version of this article.)
