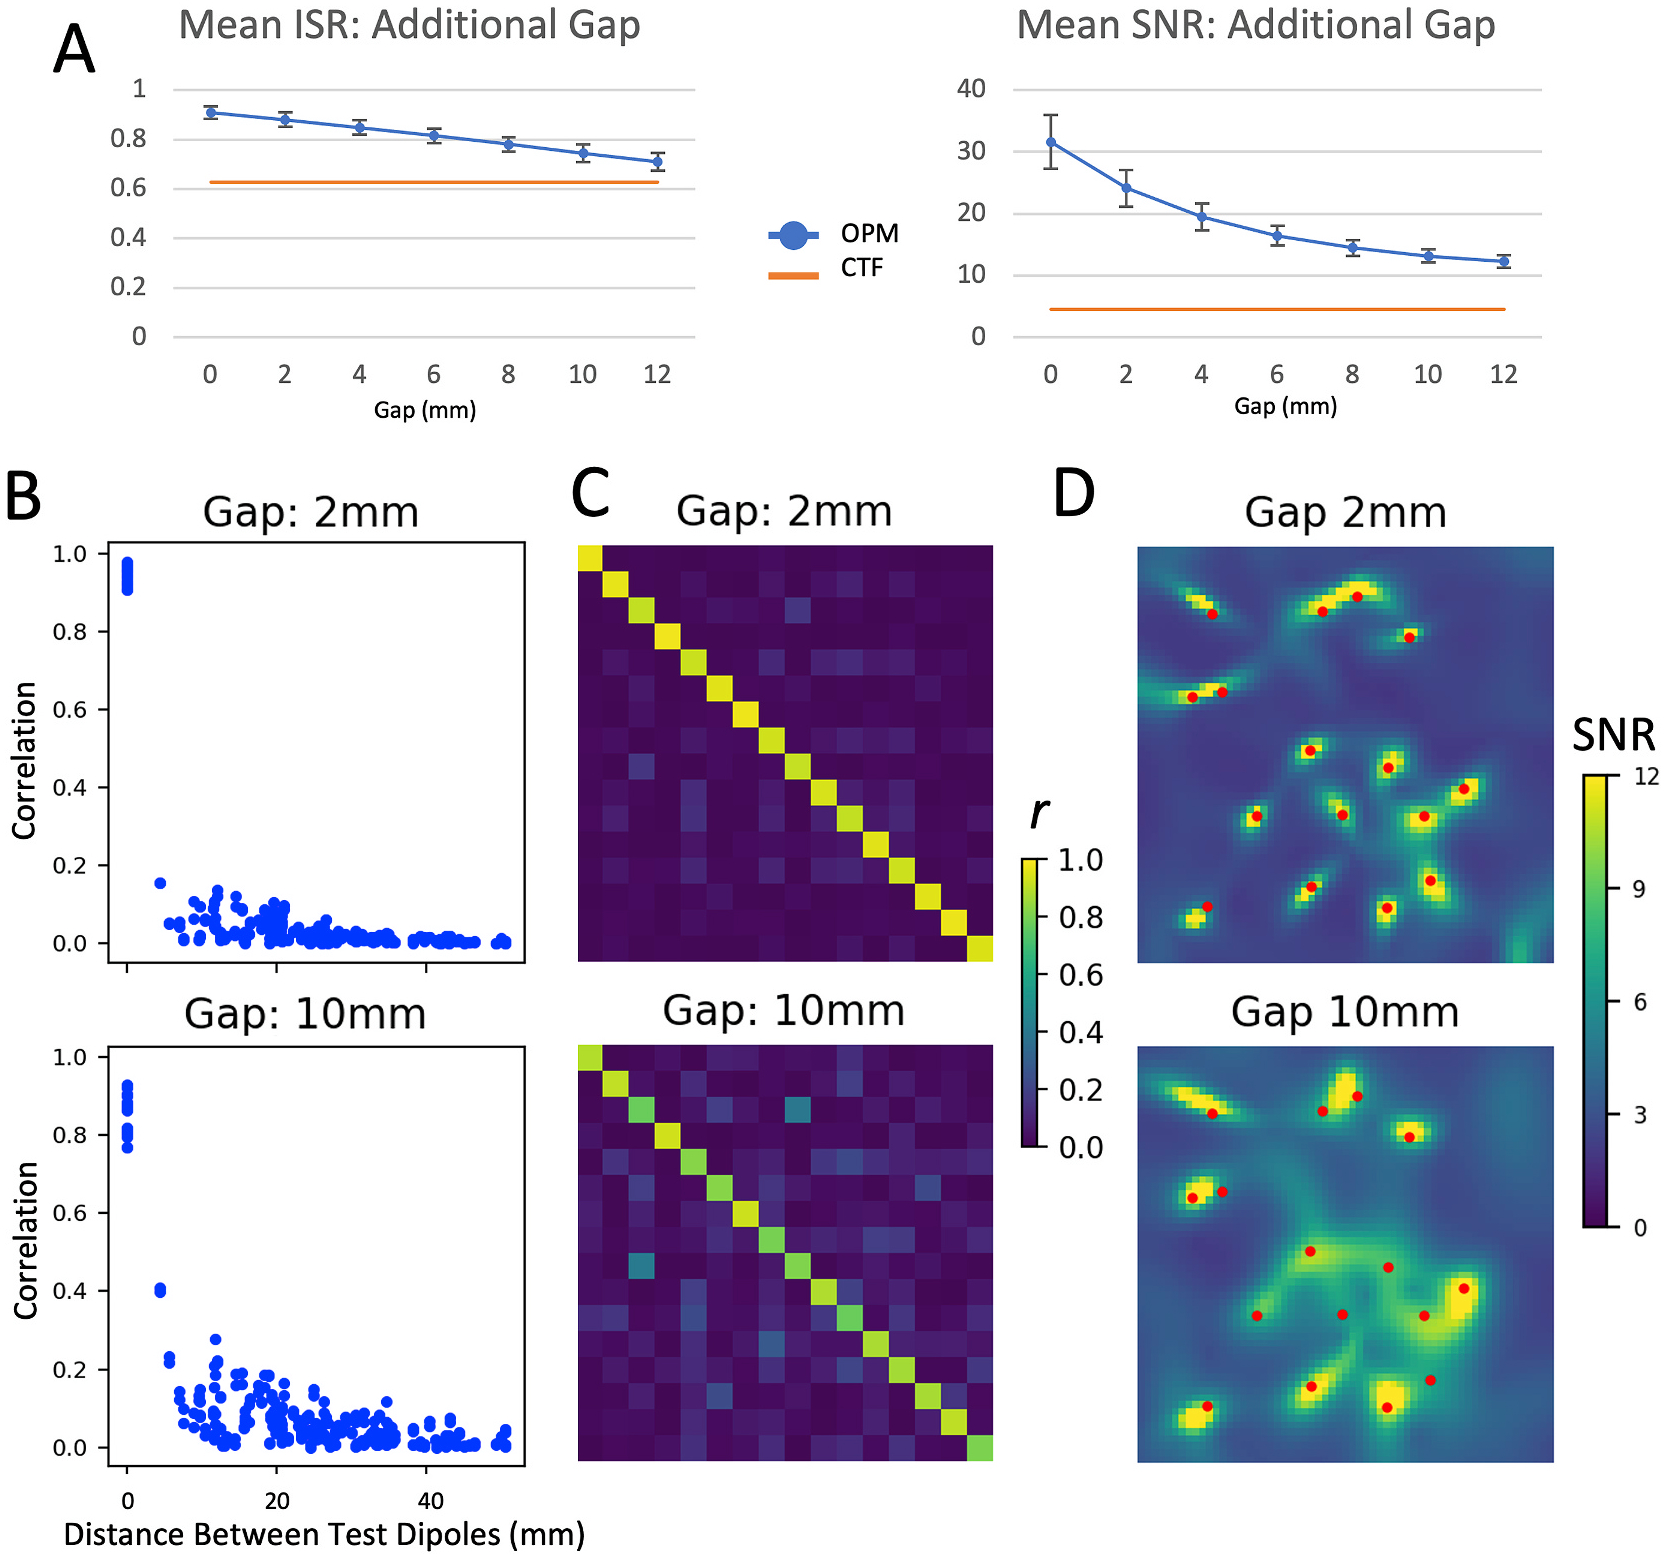
Fig. 6.

Effects of an additional gap between the OPM sensor and the test sources. Figure legend for individual panels as in Fig. 3; mean ISR and SNR is shown for additional gaps between 0 and 12 mm; other metrics (correlation [C] and LCMV beamformer images [D]) are shown for gaps of 2 mm and 10 mm.
