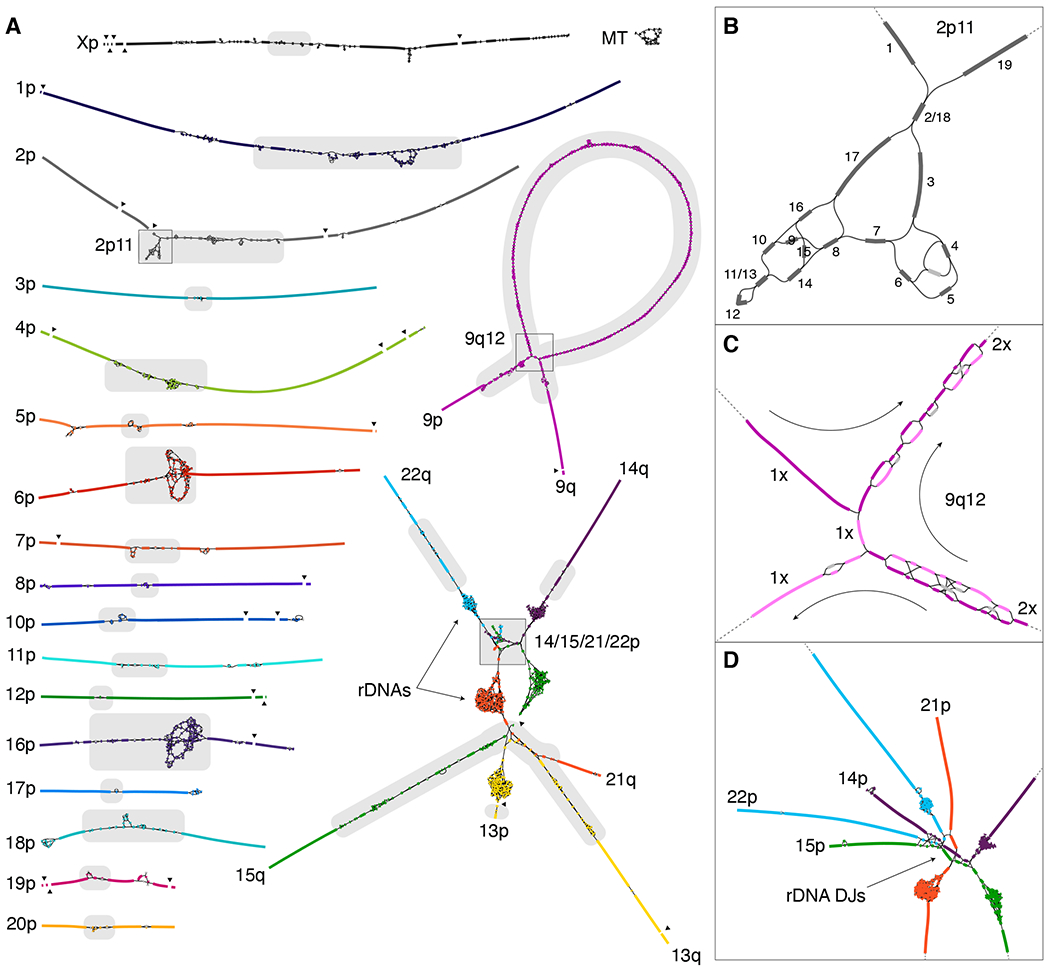
Fig. 2. High-resolution assembly string graph of the CHM13 genome.

(A) Bandage (60) visualization, where nodes represent unambiguously assembled sequences scaled by length, and edges correspond to the overlaps between node sequences. Each chromosome is both colored and numbered on the short (p) arm. Long (q) arms are labeled where unclear. The five acrocentric chromosomes (bottom right) are connected due to similarity between their short arms, and the rDNA arrays form five dense tangles due to their high copy number. The graph is partially fragmented due to HiFi coverage dropout surrounding GA-rich sequence (black triangles). Centromeric satellites (30) are the source of most ambiguity in the graph (gray highlights). (B) The ONT-assisted graph traversal for the 2p11 locus is given by numerical order. Based on low depth-of-coverage, the unlabeled light gray node represents an artifact or heterozygous variant and was not used. (C) The multi-megabase tandem HSat3 duplication (9qh+) at 9q12 requires two traversals of the large loop structure (the size of the loop is exaggerated because graph edges are of constant size). Nodes used by the first traversal are in dark purple and the second traversal in light purple. Nodes used by both traversals typically have twice the sequencing coverage. (D) Enlargement of the distal short arms of the acrocentrics, showing the colored graph walks and edges between highly similar sequences in the distal junctions (DJs) adjacent to the rDNA arrays.
