
Fig. 3. Sequencing coverage and assembly validation.
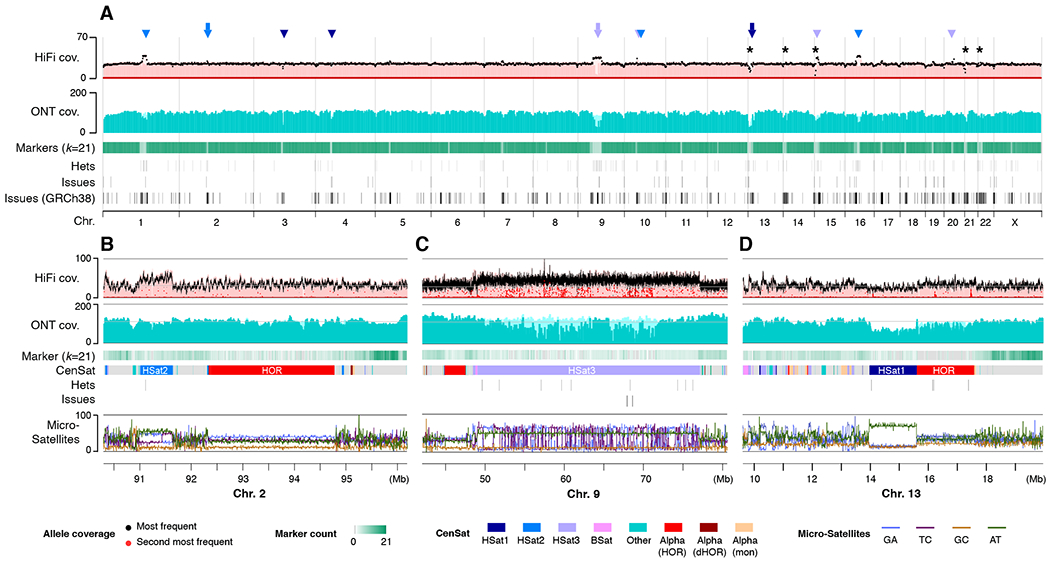
(A) Uniform whole-genome coverage of mapped HiFi and ONT reads is shown with primary alignments in light shades and marker-assisted alignments overlaid in dark shades. Large HSat arrays (30) are noted by triangles, with inset regions are marked by arrowheads and the location of the rDNA arrays marked with asterisks. Regions with low unique marker frequency (light green) correspond to drops in unique marker density, but are recovered by the lower-confidence primary alignments. Annotated assembly issues are compared for T2T-CHM13 and GRCh38. (B–D) Enlargements corresponding to regions of the genome featured in Fig. 2. Uniform coverage changes within certain satellites are reproducible and likely caused by sequencing bias. Identified heterozygous variants and assembly issues are marked below and typically correspond with low coverage of the primary allele (black) and elevated coverage of the secondary allele (red). % microsatellite repeats for every 128 bp window is shown at the bottom.