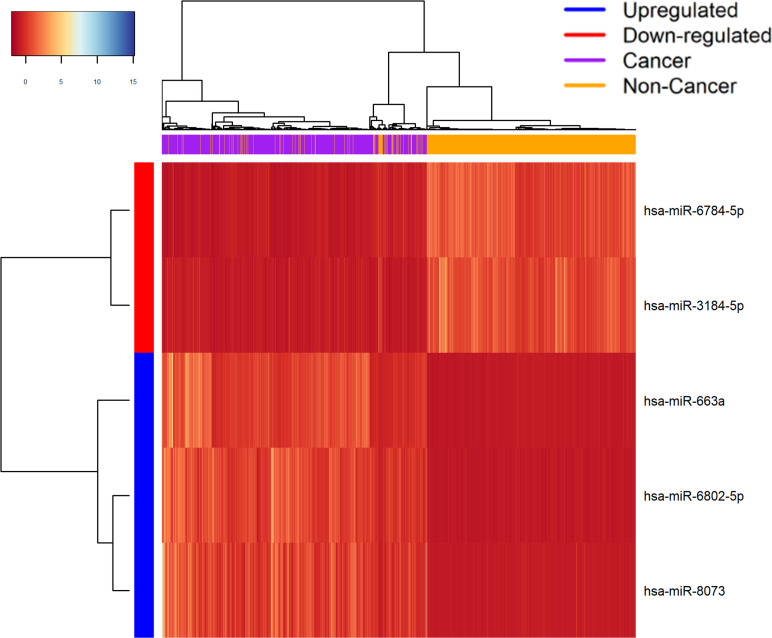
Fig 2. Heatmap of the expression value of the top 5 miRNAs selected from highest frequency miRNAs in 100 random forest models.
The X-axis represents the samples, and the Y-axis represents the miRNAs. Each of the boxes represents the normalized expression value of each miRNA in the corresponding sample.

