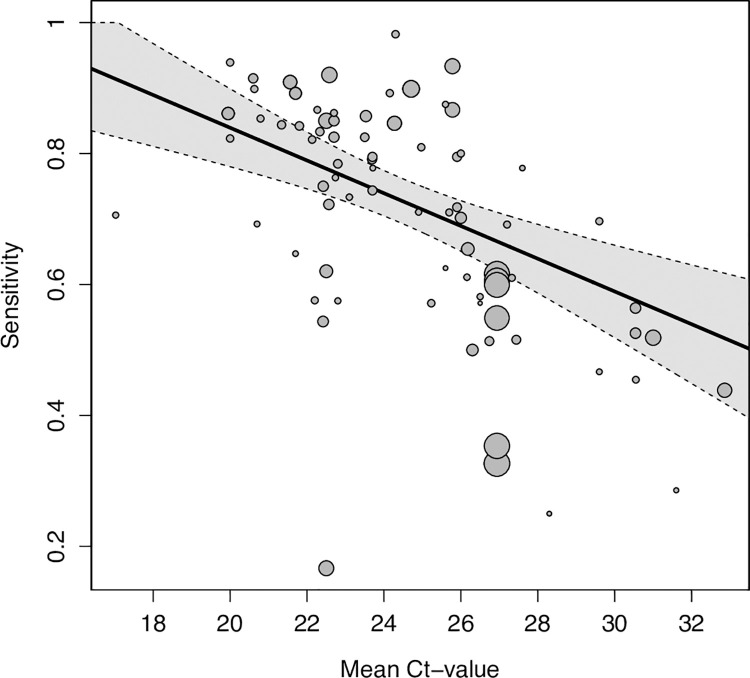
Fig 4. Pooled estimate of sensitivity across mean Ct-values holding symptom status and IFU-status constant at their respective means.
Dotted lines are the corresponding 95% CIs. The size of each point is a function of the weight of the data set in the model, where larger data sets have larger points. CI, confidence interval; Ct, cycle threshold; IFU, instructions for use.

