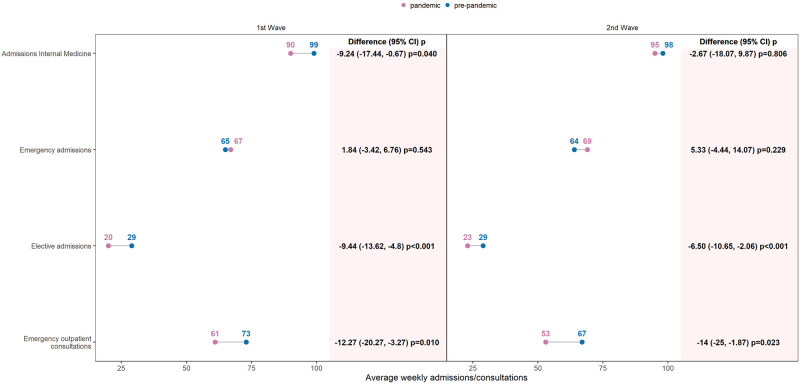
Fig 1. Yearly changes in pandemic year (2020) weekly admissions and emergency outpatient consultations, compared to pre-pandemic years (2017–2019).
Connected dots represented the average number of weekly admissions and emergency outpatient consultations in pre-pandemic versus pandemic period during the two pandemic waves. Differences between the two means and 95% bootstrap Confidence Interval (CI) with p-values (robust t-test) were indicated in columns. 1st Wave: calendar weeks (10–24); 2nd Wave: calendar weeks (39–53).

