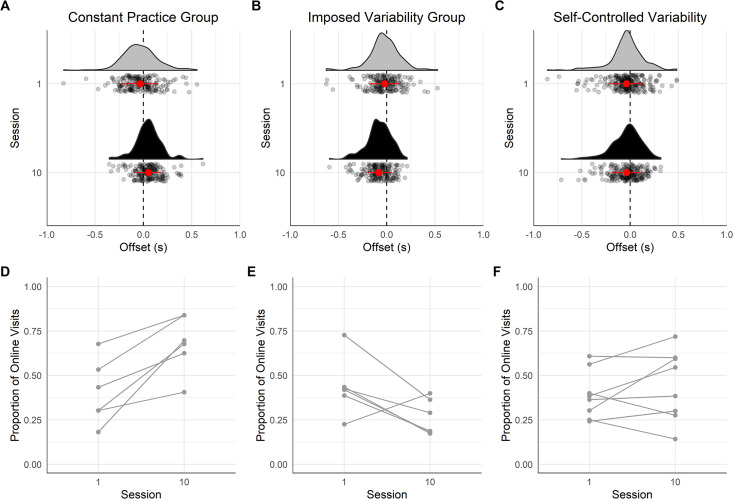
Fig 4. Offset time of the last gaze visit before the hand contacted the handhold for the three groups on the training route.
In (A), (B) and (C), the vertical dashed line shows the time the hand touched the handhold, each point represents one gaze visit, the half violin shows the density of points, the red/grey point with the error bar refers the mean of all the gaze visits and the standard deviation around the mean. The color of the half violin refers to the learning session: in grey, session 1 and in black, session 10. (D), (E) and (F) displays the individuals’ proportion of online visits on session 1 and 10. (A) and (D) show data for the constant practice group, (B) and (E) for the imposed variability group, and (C) and (F) for the self-controlled variability group.

