
Figure 2. Pharmacokinetics of each agent.
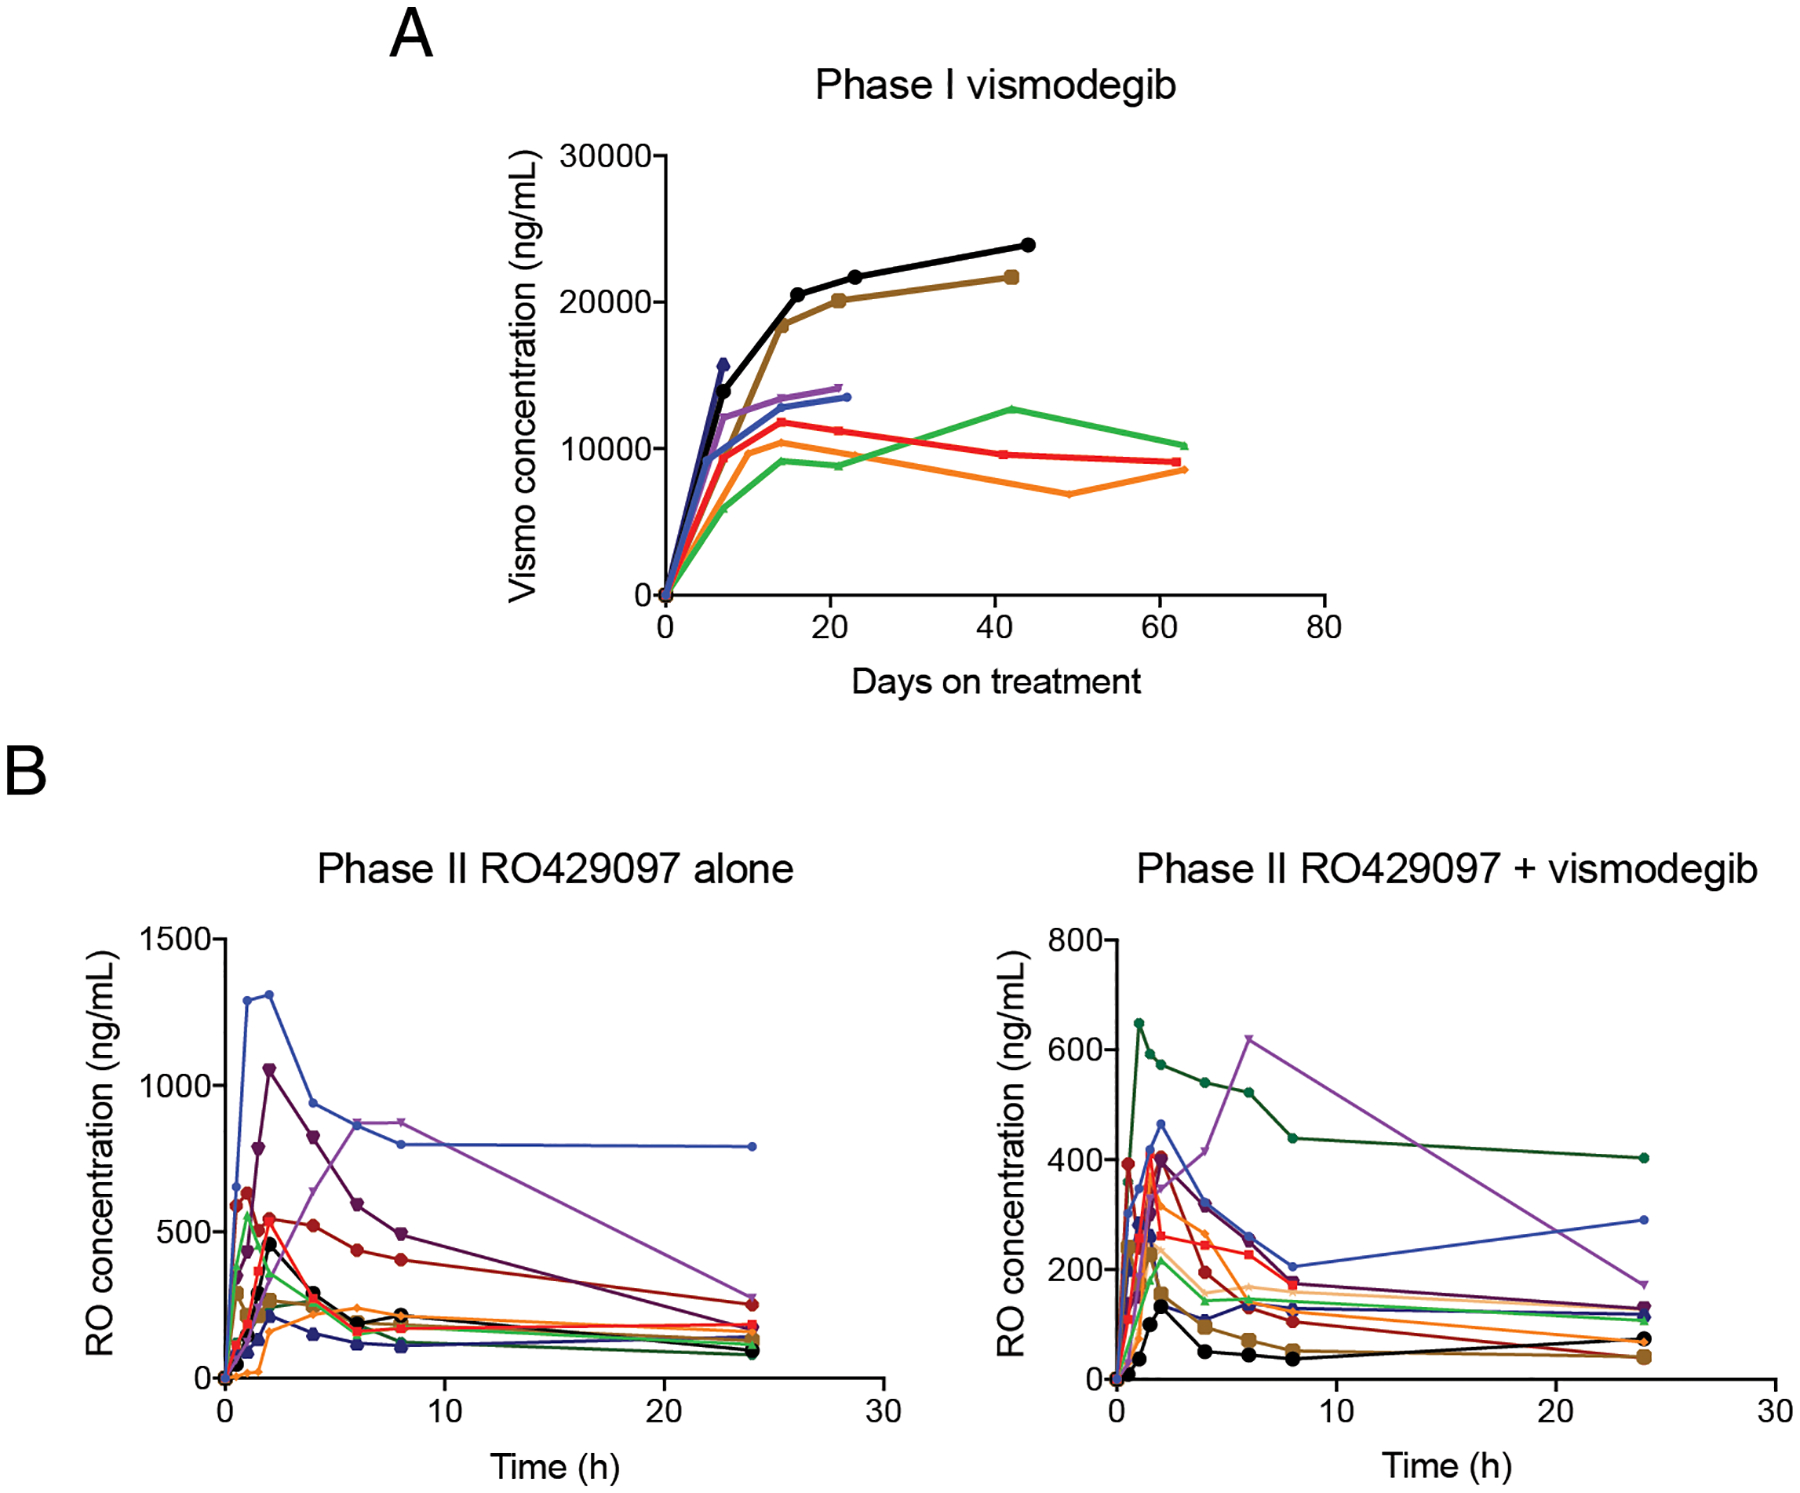
A, Plasma concentrations of total vismodegib in 8 patients in Phase Ib. B-C, plasma concentrations of total RO4929097 on the monotherapy arm (B) and combination therapy arm (C), in 10 and 12 patients, respectively, in Phase II. Each line represents an individual patient.