
Figure 5. Pharmacodynamic indicators of vismodegib.
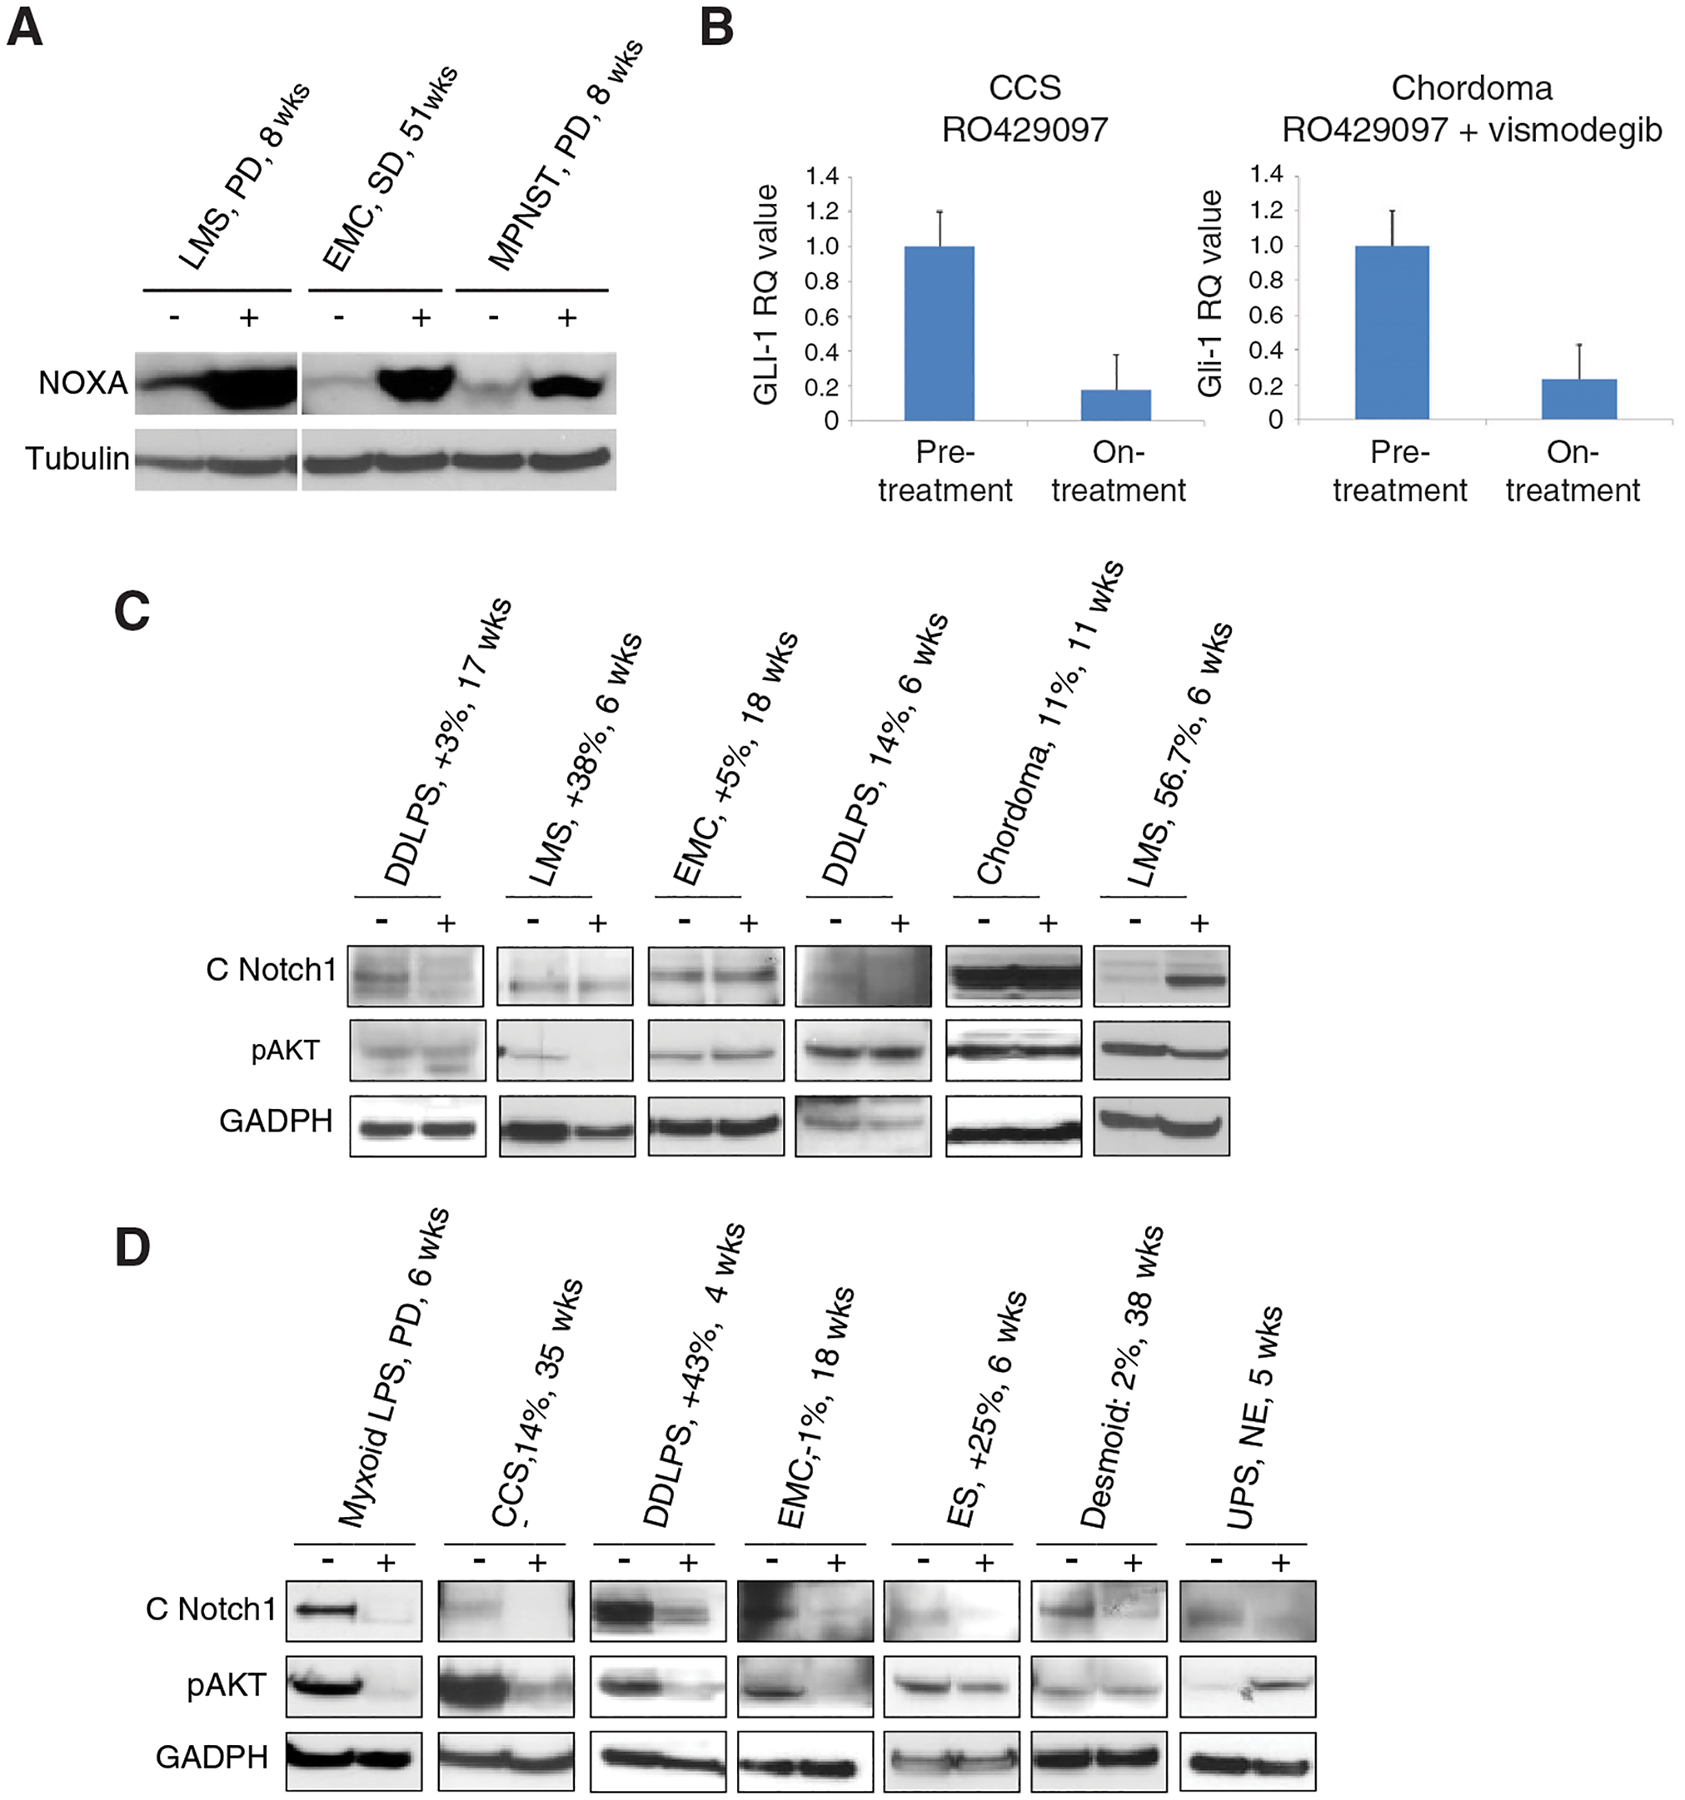
A, Western blot demonstrating induction of the pro-apoptotic protein NOXA in select paired biopsies treated with vismodegib. B, RT-PCR of GLI1 in paired tumor tissue from patients with clear cell sarcoma on the combination therapy arm (left) and chordoma on the RO4929097 monotherapy arm (right). C-D, Western blot indicating changes in cleaved Notch1 (C Notch1) and phosphorylated Akt (pAkt) in select paired biopsies on the RO4929097 (C) and combination (D) arms of the randomized phase II study portion. “-“ denotes baseline and “+” denotes on-treatment biopsy. GAPDH and tubulin are shown to confirm relative equal protein loading. Patients’ sarcoma type, best response of target lesion by RECIST 1.1, and time on study indicated above each pair of lanes. DDLPS, de-differentiated liposarcoma; LMS, leiomyosarcoma; EMC, extraskeletal myxoid chondrosarcoma; LPS, liposarcoma; CCS, clear cell sarcoma; UPS, undifferentiated pleomorphic sarcoma; MPNST, malignant peripheral nerve sheath tumor.