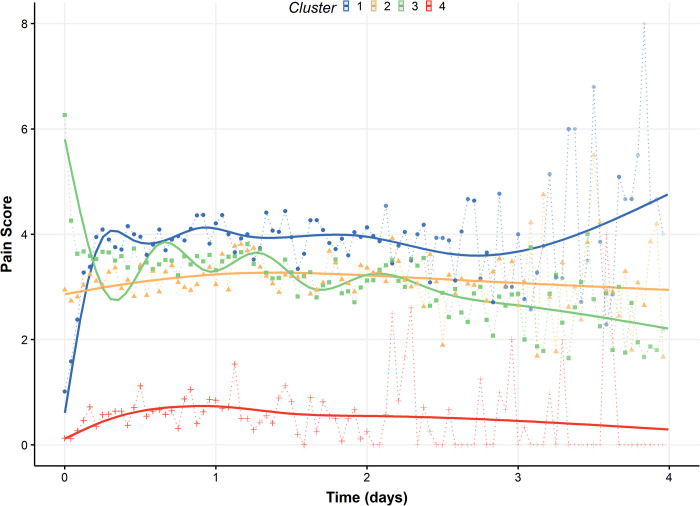
Fig 2. Estimated acute pain trajectories by cluster.
The points and the dotted lines represent the mean acute pain of patients during each hour of observation. The solid lines show loess-smoothed pain trajectories. Areas under the curve (AUC) for each cluster (1–4) are 549095, 519615, 667908, and 877505, respectively.

