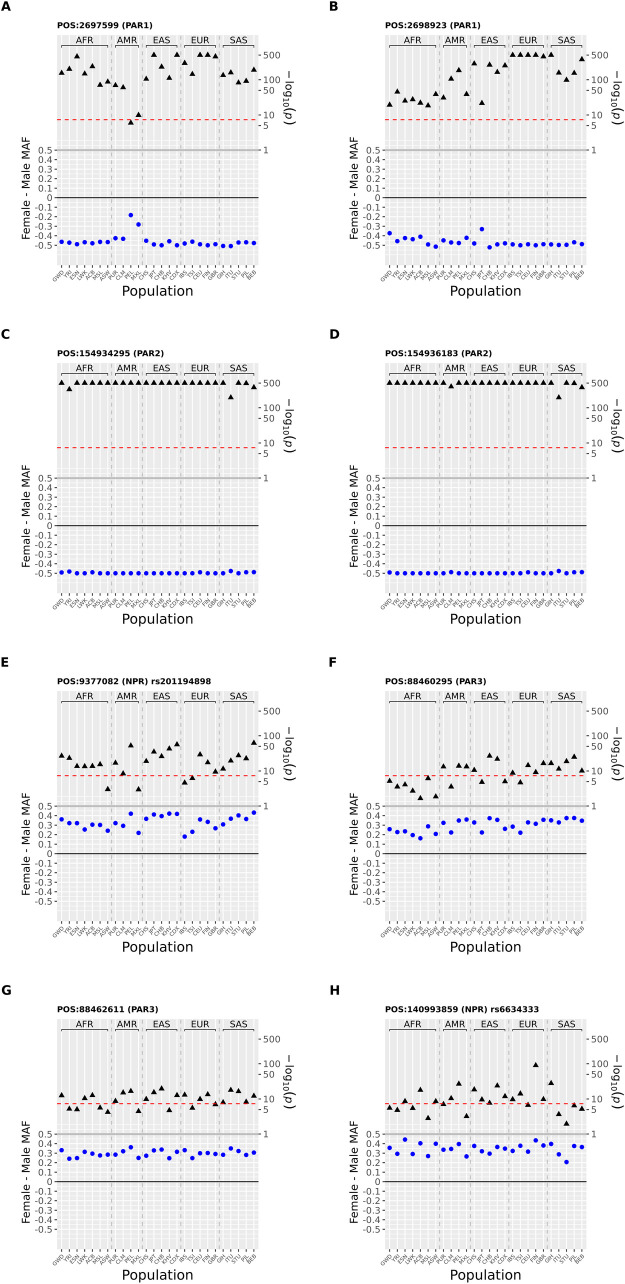
Fig 3. Population-specific sdMAF results for 8 X chromosomal SNPs from 1000 Genomes Project phase 3 data across the 26 populations.
The 8 SNPs were selected (two each from the 4 regions: PAR1, PAR2, PAR3 and NPR) with the smallest sdMAF p values (see text). Analysis was performed separately for the 26 populations and sdMAF (female-male, blue circles) as well as their corresponding -log10(p value) (black triangles) are plotted on the left and right Y axes, respectively. Populations are labelled on the X axis using the conventional 1000 Genomes Project codes, and grouped by super-population. Physical position is GRCh37 and rs provided where available. The red dashed horizontal line is a p = 5x10⁻⁸. SNPs in each part are: A position = 2697599 (PAR1); B position 2698923 (PAR1) and C position 154934295 (PAR2); D position 154936183 (PAR2); E position = 9377082 rs201194898 (NPR); F position = 88460295 (PAR3); G position = 88462611 (PAR3); H position = 140993859 rs6634333 (NPR).

