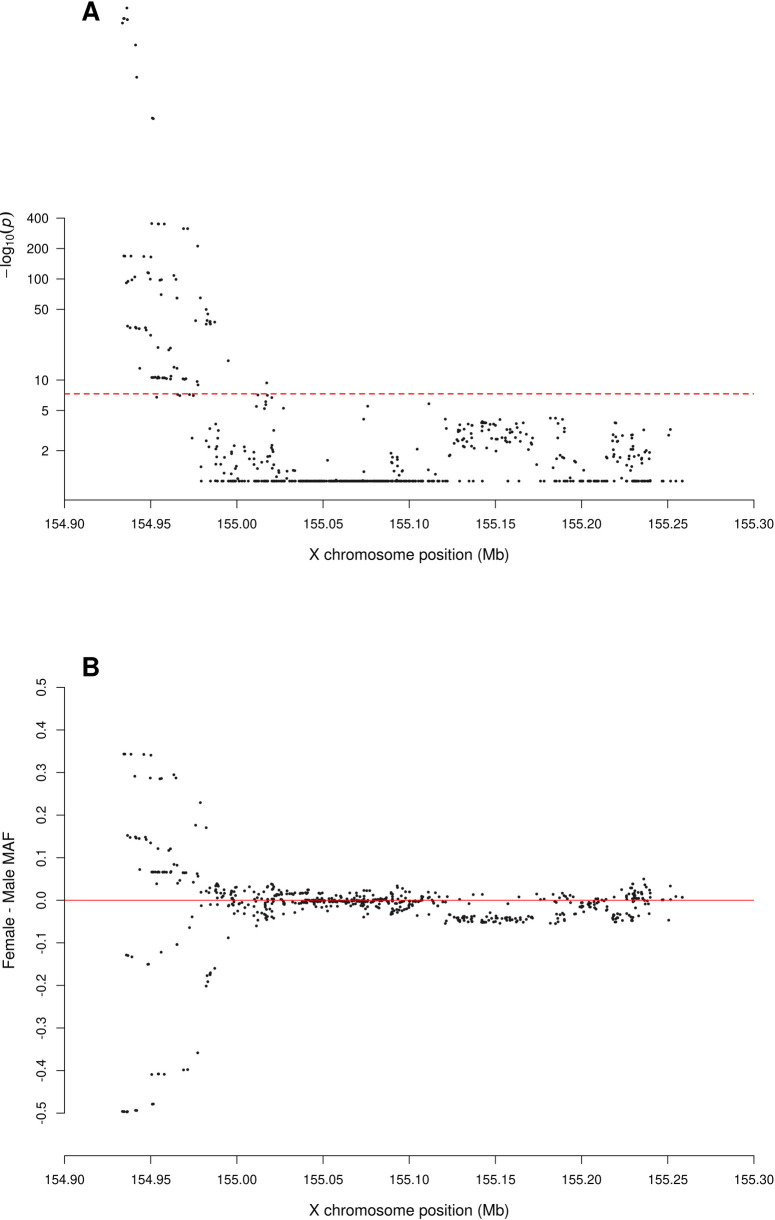
Fig 5. Zoomed-in plot for testing for sex difference in MAF across PAR2 of the X chromosome from the 1000 Genomes Project phase 3 data on GRCh37.
A: sdMAF p-values for bi-allelic SNPs with global MAF ≥5% presumed to be of high quality. Y-axis is −log10(sdMAF p-values) and p-values >0.1 are plotted as 0.1 (1 on −log10 scale) for better visualization. The dashed red line represents 5e-8 (7.3 on the −log10 scale). B: Female—Male sdMAF for the same SNPs in part A, clearly showing PAR2 SNPs with significant sdMAF tend to cluster at the NPR-PAR2 boundary around 88.5 Mb.

