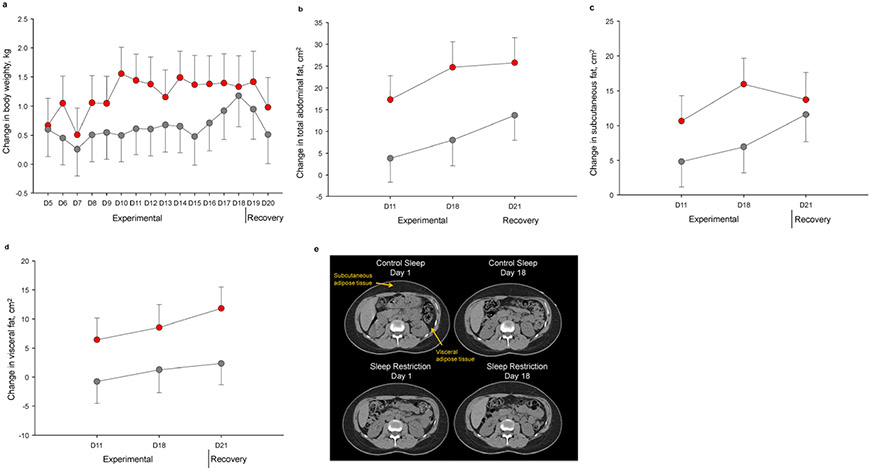
Figure 3. Changes in body weight and regional fat distribution.
Adjusted mean changes from acclimation to experimental and recovery study phases in body weight (a), total abdominal fat (b), subcutaneous fat (c), and visceral fat (d) areas across study days. Sleep restriction is presented in red and control sleep in gray. Error bars indicate SE. e. Representative abdominal computed tomography scans from a study participant during acclimation (Day 1) and experimental (Day 18) phases of control sleep (top left and top right, respectively), and of sleep restriction (bottom left and bottom right, respectively). Arrows indicate subcutaneous and visceral fat.

