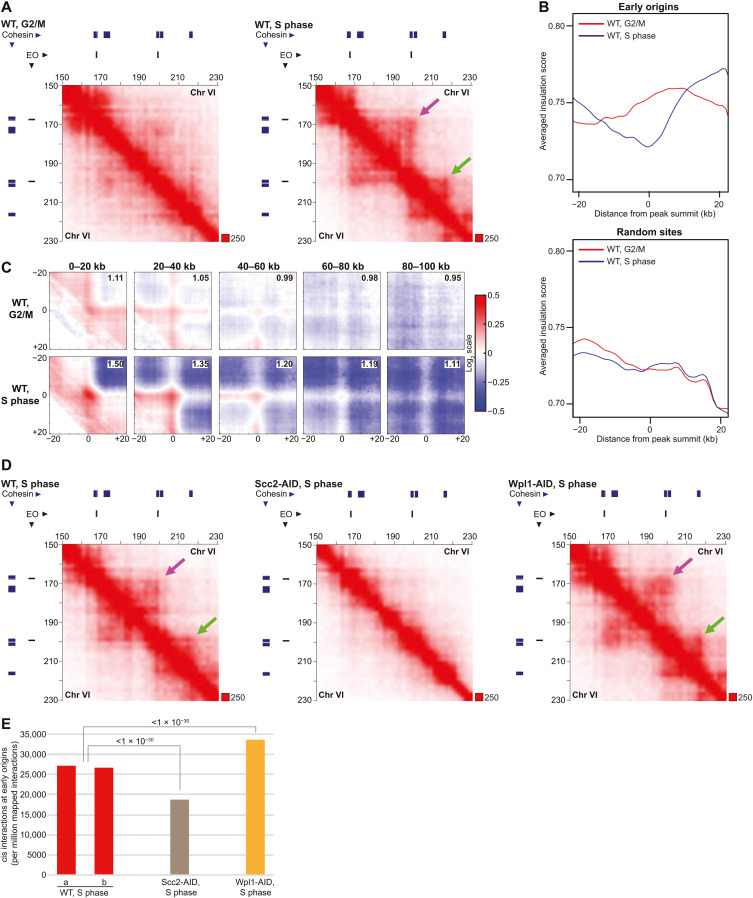
Fig. 5. Stalled replication forks act as barriers for loop extruding cohesin.
(A) Normalized Hi-C contact maps (2-kb binning) showing cis interactions along the arm of chromosome VI (150 to 230 kb from left telomere) in G2/M-arrested WT cells and S phase–arrested WT cells. Purple arrow, interactions between neighboring early replication origins; green arrow, replication origin-cohesin site interaction formed in S phase. Blue and black lines on top and to the left of the panels, cohesin binding sites and early firing origin (EO), respectively. (B) Averaged insulation score plots based on normalized Hi-C data as in (A). The analysis focuses on 40-kb regions spanning early replication origins on chromosome arms (top) or random sites (bottom). (C) APA centered on interactions between pairs of early origins and cohesin sites, separated by increasing chromosomal distances as indicated on top of the panels. The analysis is based on normalized Hi-C data from G2/M-arrested, or S phase–arrested WT cells as in (A). The strength of the central loop signal is displayed in the upper right corner of each panel. (D) Normalized Hi-C contact maps in S phase–arrested WT cells, or in S phase–arrested cells predepleted of Scc2 and Wpl1 (Scc2-AID, Wpl1-AID), as in (A). (E) Quantification of cis interactions (>10 kb) anchored at early replication origins in S phase–arrested WT cells or in S phase–arrested cells predepleted of Scc2 and Wpl1 (Scc2-AID, Wpl1-AID). Statistical significance is indicated with P values from a binominal test. Results from two biological repeats are shown for WT.

