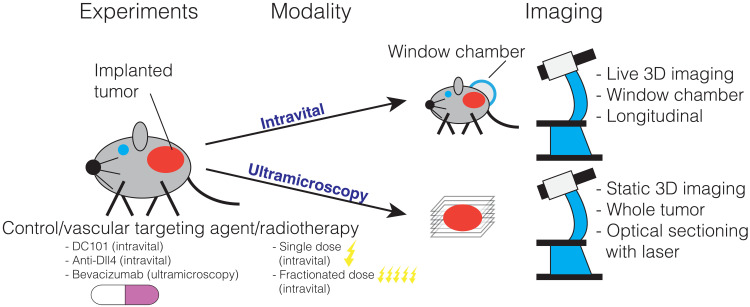
Fig. 1. Description of datasets.
We illustrate the treatments and imaging techniques used to generate the experimental data that we analyze. Both datasets consist of 3D stacks of tumor vasculature images from mice undergoing different treatments (vascular targeting agents and radiotherapy). Intravital data were collected from live animals observed over several days. Ultramicroscopy data (8) were obtained from multiple tumors excised at different times after treatment (one time point per tumor). These data are not directly comparable since they were generated from two different mouse models (see Table 1) using different experimental setups (see Materials and Methods).

