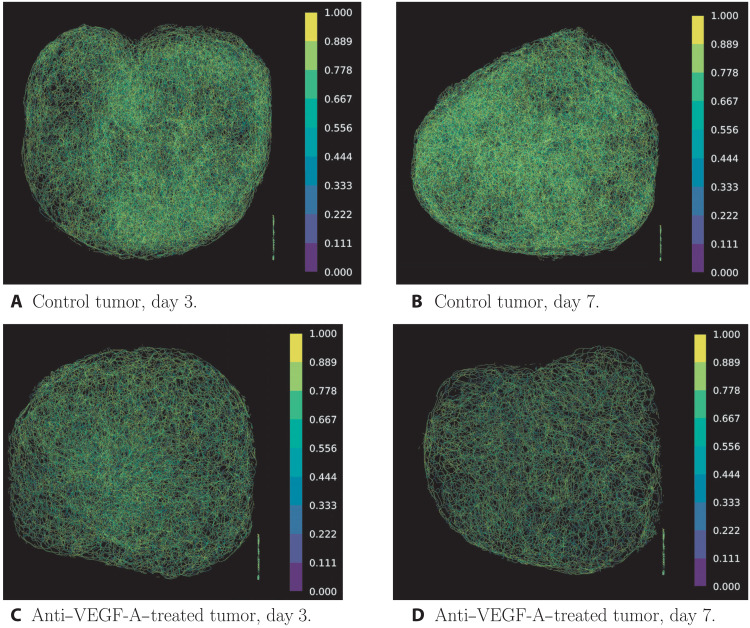
Fig. 2. Example images of extracted vessel networks from multispectral fluorescence ultramicroscopy data colored according to tortuosity measured via clr values.
We can see a clear difference between the vessel networks of the treated and the untreated tumor on both days 3 and 7 after treatment. Note that the collection of lines in the bottom right corner of the images corresponds to text that was present in the skeleton images in the dataset. We removed these artifacts from our extracted point clouds. (A) Control tumor, day 3. (B) Control tumor, day 7. (C) Anti–VEGF-A–treated tumor, day 3. (D) Anti–VEGF-A–treated tumor, day 7.

