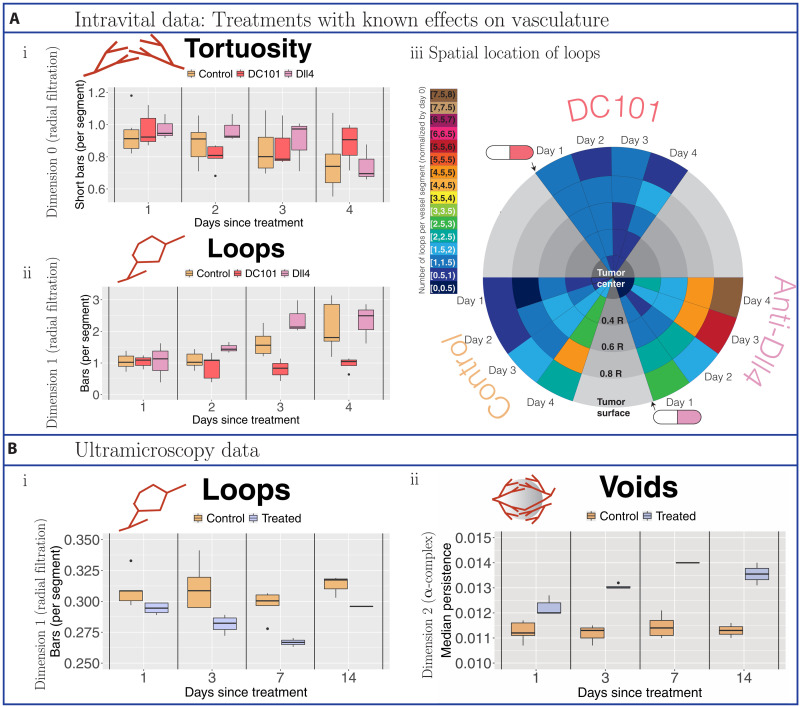
Fig. 4. Topological descriptors extracted from tumor blood vessel networks treated with vascular targeting agents with known effects.
(A) Intravital data results. We normalized all descriptors with respect to values on the day on which treatment is administered or, for controls, the day on which observations commence (day 0). Data were collected from controls (beige) and tumors treated with the vascular targeting agent DC101 (37) (dark pink) or the vascular targeting agent anti-Dll4 (39) (light pink). (i) Tortuosity was computed as the ratio of short bars in dimension 0 barcodes of the radial filtration (≤10% of maximal radius used) to the number of vessel segments. (ii) Loops are the number of bars in dimension 1 barcodes of the radial filtration per vessel segment. (iii) Spatiotemporal resolution of the number of loops per vessel segment. We illustrate the changes in the median number of loops (normalized by day 0) in radial intervals around the tumor centers over the days of observation. We point to the day following treatment with vascular targeting agents with a cartoon drug. (B) Ultramicroscopy data results. Because of the snapshot nature of the data (one time point per tumor), all reported topological descriptors are raw values. Data were collected from controls (beige) and tumors treated with bevacizumab (purple). (i) We computed the number of vessel loops per vessel segment. (ii) We determined the size of voids (avascular regions) by computing the median length of bars in the dimension 2 barcodes of the α-complex filtration.

