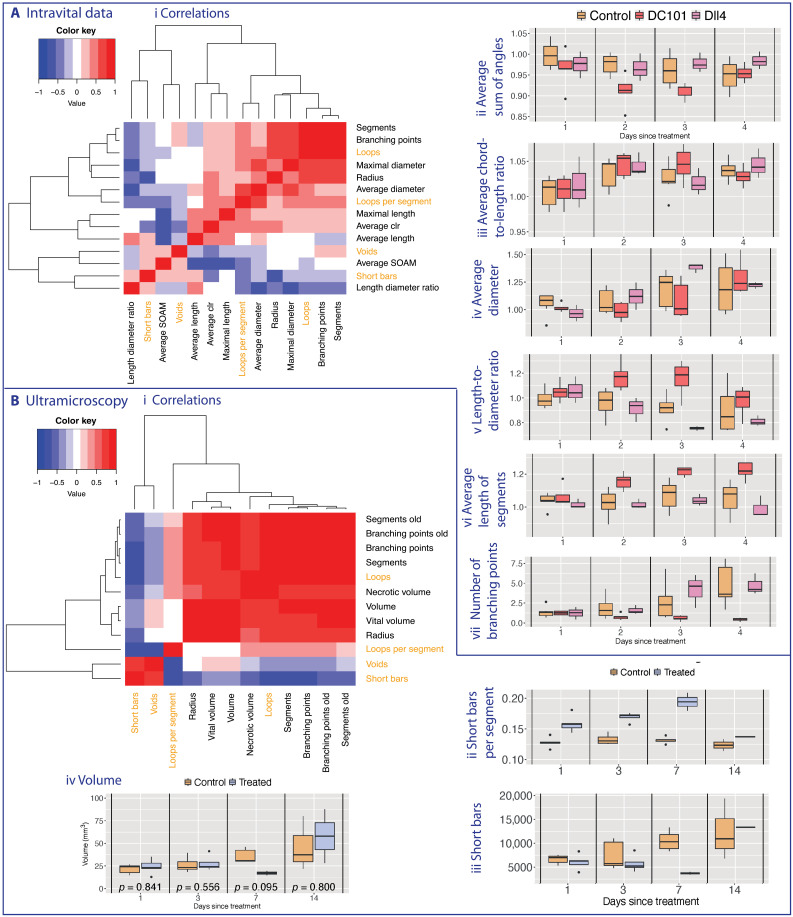
Fig. 5. Heatmaps displaying pairwise Pearson correlation coefficients between different vascular descriptors (standard and topological).
Vascular descriptors were derived from the (A) intravital data and (B) ultramicroscopy data. The dendrograms (Ai and Bi) represent complete linkage clustering using the Euclidean distance measure. We compute standard vascular descriptors for comparison (see Section Standard measures and existing descriptors in Introduction and Section Additional results and statistical analysis in SI). We highlight the topological measures in orange including both the number of loops and number of loops per vessel segment to highlight the effect of the normalization. For the ultramicroscopy data, we mark those descriptors that we report from (8) with the word “old” (as opposed to the same descriptors that we calculate as in (2,45)). We present existing tortuosity descriptors (Aii and iii) and standard measures on the data (Aiii - vi, Biv). While the proposed topological tortuosity descriptor is a good measure for intravital data (see Fig. 4), care must be taken with the ultramicroscopy data (Bii and iii, see Section Tortuosity in the ultramicroscopy data in SI for details).

