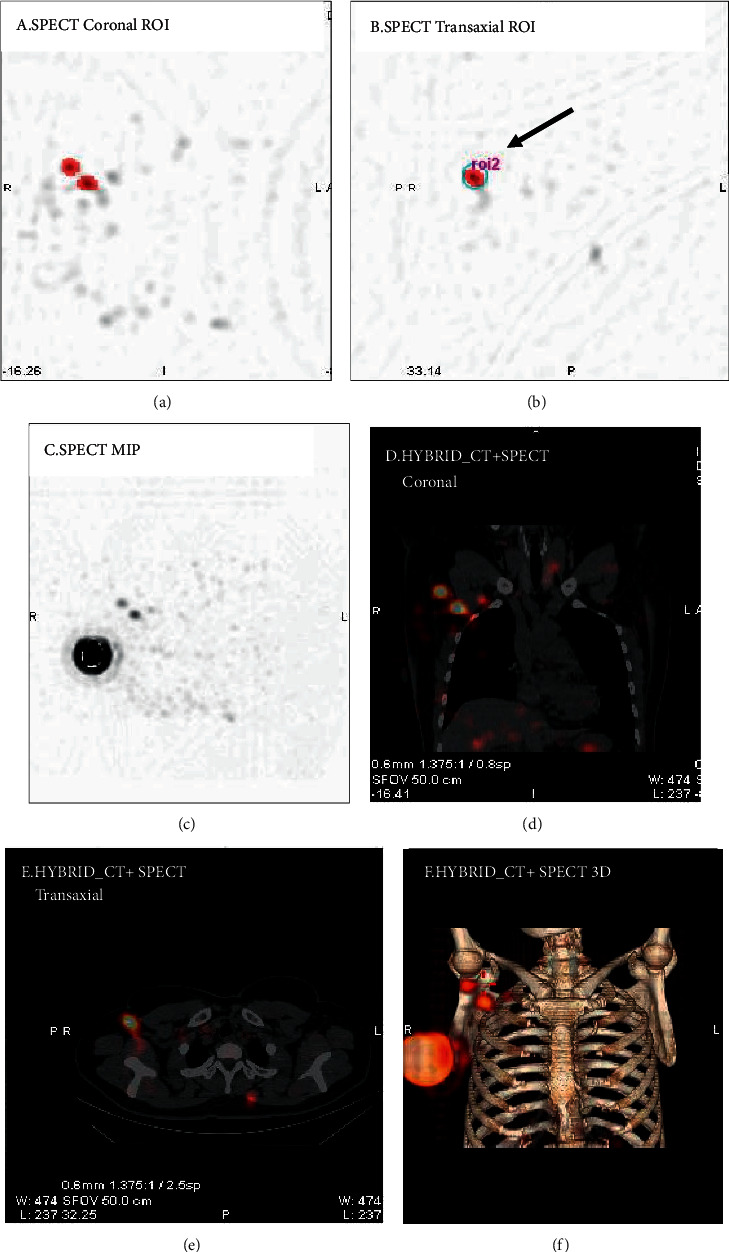
Figure 1.

Graphical images describing the semiautomatic segmentation for the region of interest (ROI) and generation of radioactivity counts of hot nodes. (a–f) Coronal, transaxial, and MIP views of SPECT and corresponding hybrid SPECT/CT images.

Graphical images describing the semiautomatic segmentation for the region of interest (ROI) and generation of radioactivity counts of hot nodes. (a–f) Coronal, transaxial, and MIP views of SPECT and corresponding hybrid SPECT/CT images.