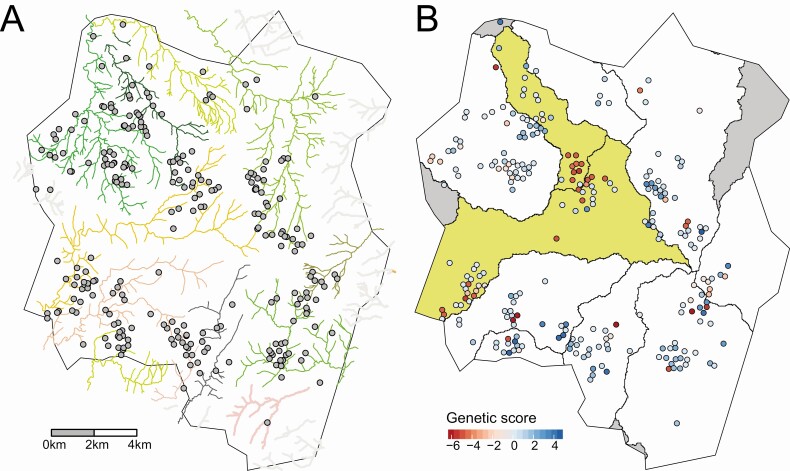
Figure 4.
A. Major rivers of Blantyre with points indicating the approximate household locations of patients with typhoid fever. B, Approximate household locations are colored by genetic score, and river catchments are outlined using polygons. Catchments 2 and 8 are highlighted in yellow. Catchments not included in the analysis are in gray. Precise locations of households are masked by randomization.

