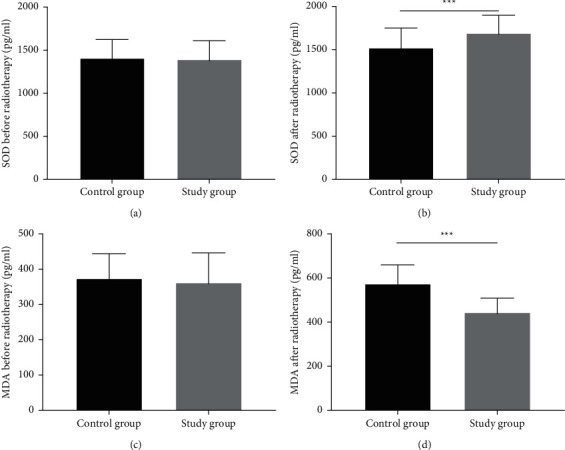
Figure 1.

Analysis of SOD and MDA. (a) The serum level of SOD before radiotherapy, (b) the serum level of SOD after radiotherapy, (c) the serum level of MDA before radiotherapy, and (d) the serum level of MDA after radiotherapy. ∗∗∗indicates P < 0.001.
