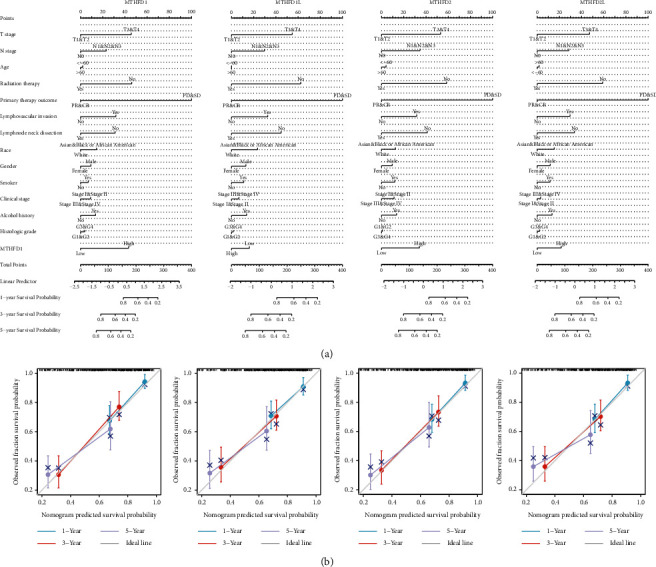
Figure 5.

The nomogram plots and calibration plots. (a) The nomogram plots were used for predicting the survival probability of OSCC at 1-, 3-, and 5-years, integrating various clinicopathological factors and MTHFD family genes. (b) The calibration plots were used to evaluate the accuracy of the model established in the nomogram plot.
