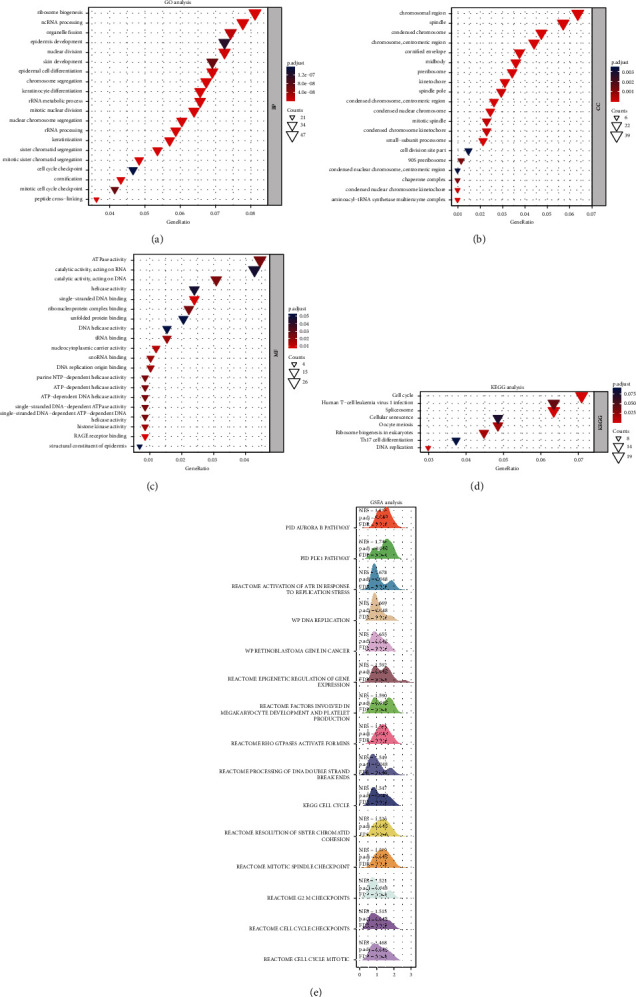
Figure 7.

Functional enrichment analysis and gene set enrichment analysis of the correlated genes of MTHFD family genes in OSCC. (a)–(d) GO and KEGG analysis showed the top 20 functional terms enriched by the top 100 positively and top 100 negatively correlated MTHFD family genes. (e) The mountain plot showed the results of gene set enrichment analysis (GSEA), which was based on the significantly correlated genes (correlation coefficient value |r| > 0.4; P < 0.05) of MTHFD family genes.
