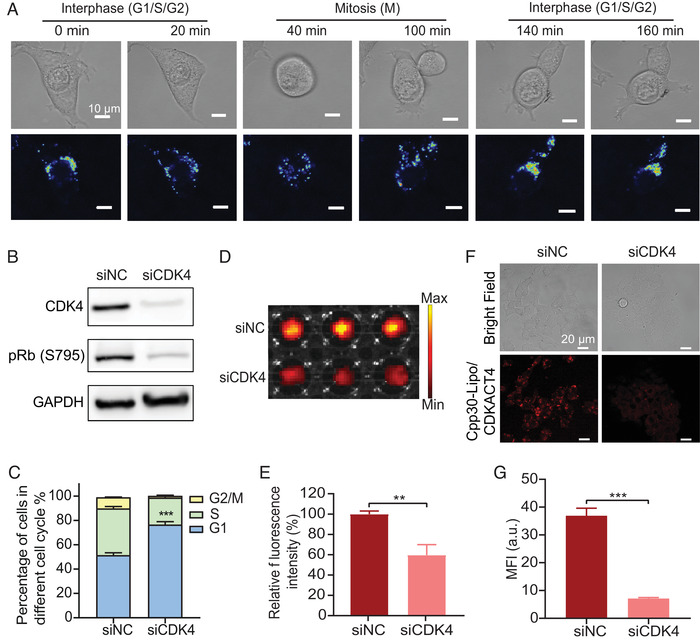
FIGURE 4.

CPP30‐Lipo/CDKACT4 reports the cell cycle and CDK4 activity in living cells. (A) Timelapse micrographs of dividing cells: overlaid images of phase contrast and spectral representation of relative CPP30‐Lipo/CDKACT4 fluorescence intensity. Scale bar = 10 μm. (B) Western blot of CDK4 and pRb (S795) protein levels from MCF‐7 cells treated with siRNA directed against CDK4 (siCDK4) or none (siNC). (C) Cell distribution of siNC‐treated MCF‐7 cells and siCDK4‐treated MCF‐7 cells in different phases of the cell cycle (n = 3, ***p < 0.001). (D, E) Fluorescence images (D) and mean fluorescence intensity (MFI) (E) of siNC‐treated MCF‐7 cells and siCDK4‐treated MCF‐7 cells after incubation with CPP30‐Lipo/CDKACT4 (n = 3, **p < 0.01). (F, G) Representative fields under fluorescence microscopy (F) and MFI (G) of siNC‐treated MCF‐7 cells and siCDK4‐treated MCF‐7 cells after incubation with CPP30‐Lipo/CDKACT4 (n = 3, ***p < 0.001). Scale bar = 20 μm
