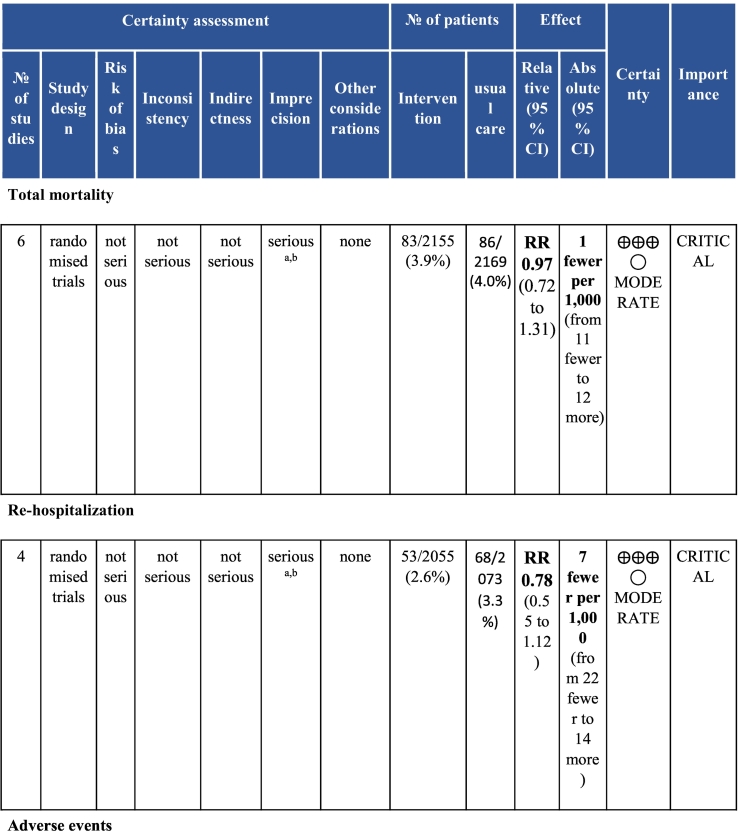
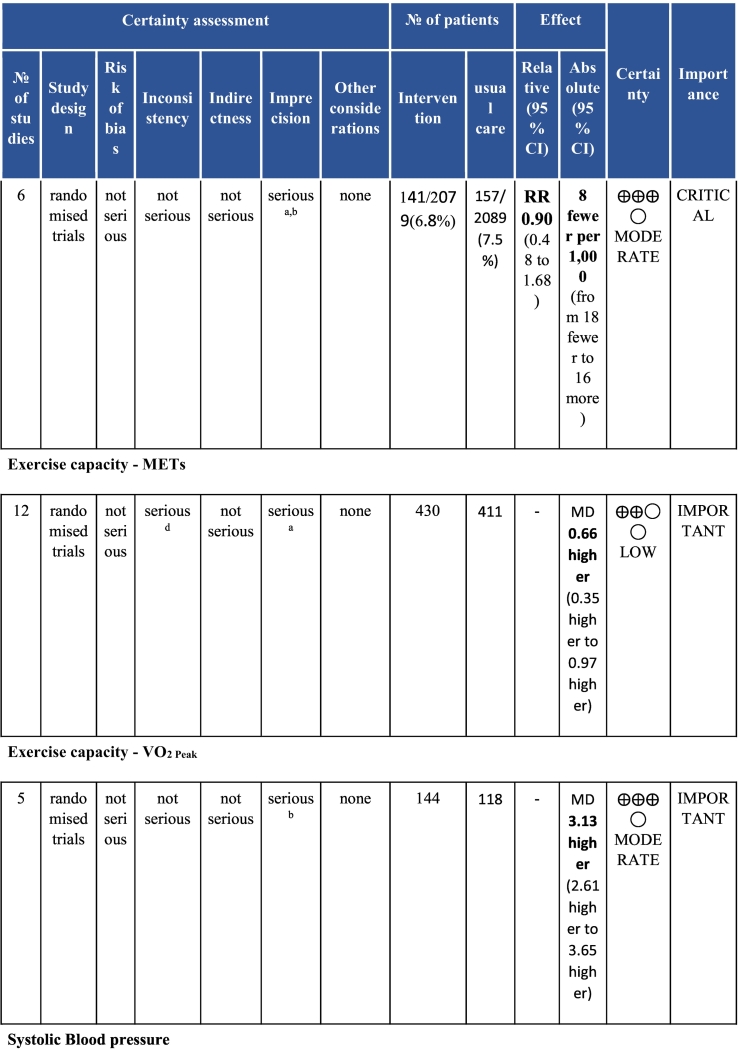
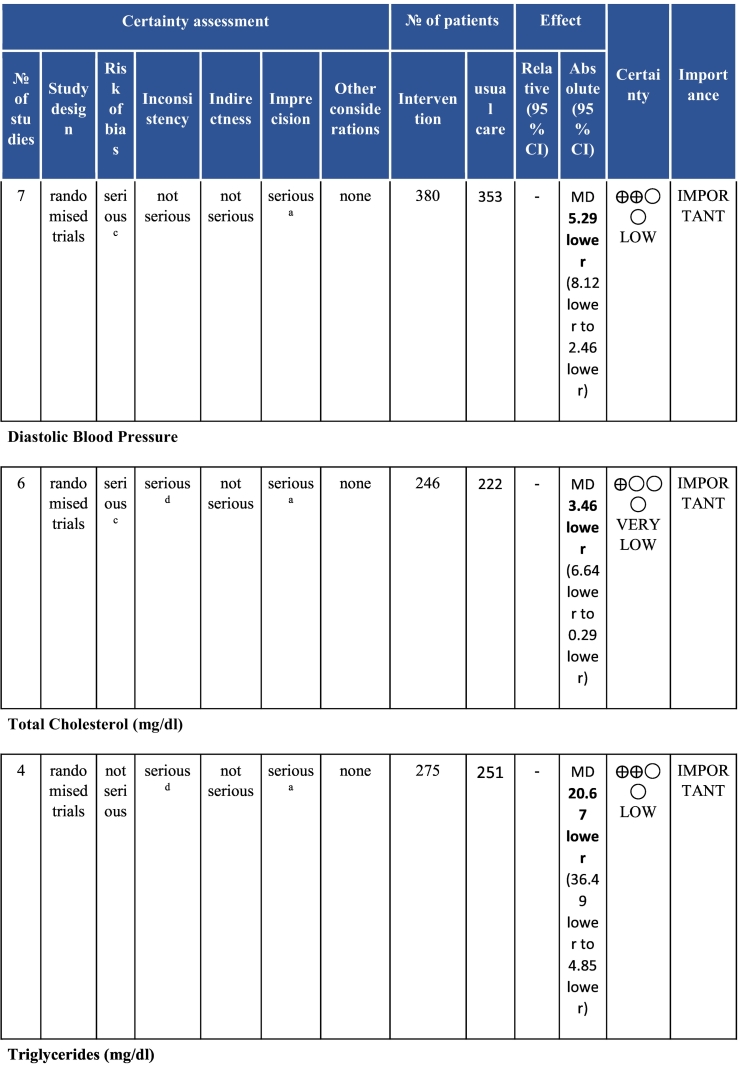
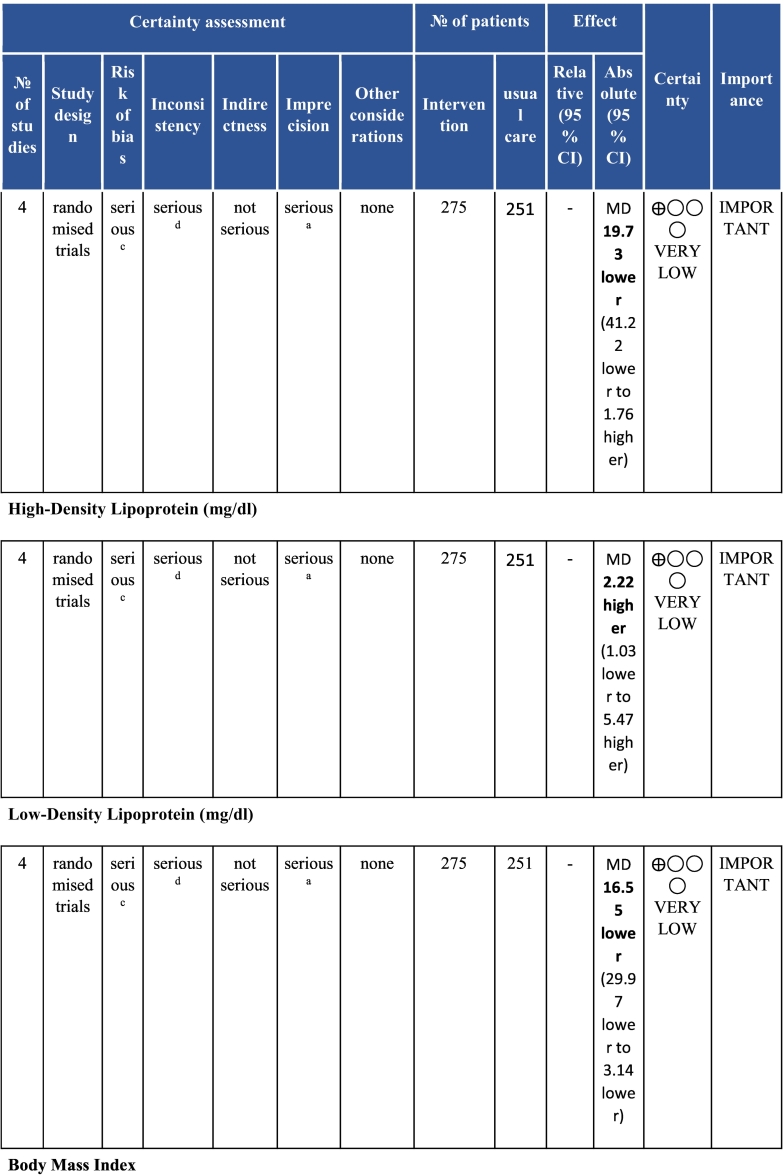
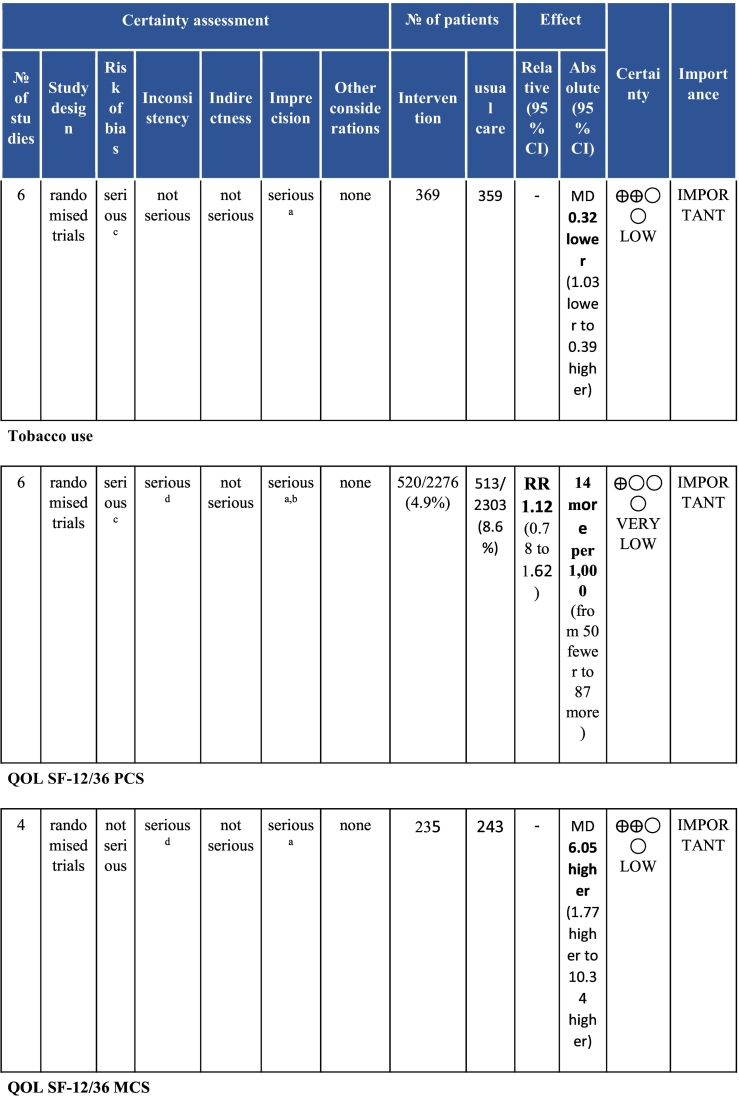
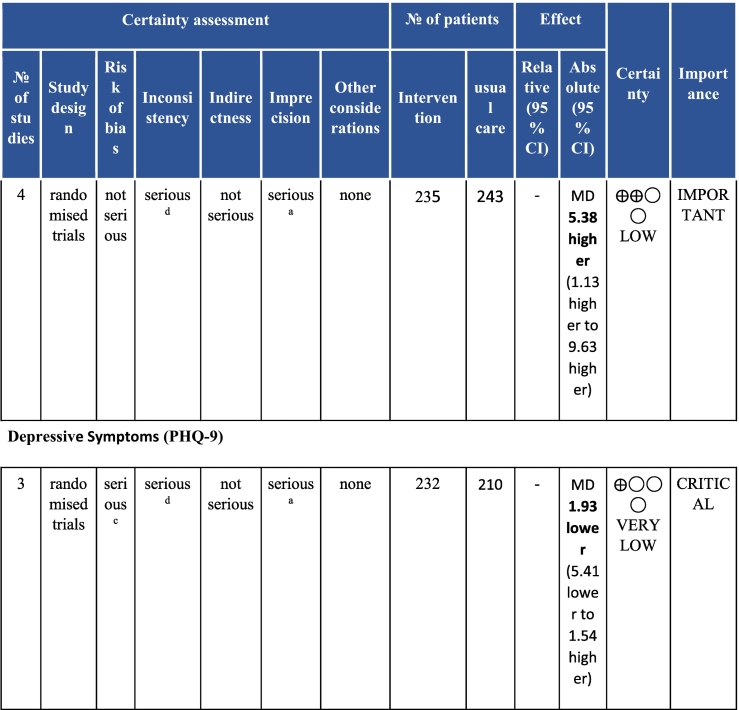
Table 3a.
Summary of findings and certatpinty assessment: Intervention compared to Usual care.
CI: Confidence interval; RR: Risk ratio; MD: Mean difference; QOL SF-12/36 PCS, MCS: short-form quality of life survey from Rand Corporation, physical and mental component summary scores; METs: metabolic equivalent of tasks; PHQ: patient health questionnaire (https://www.phqscreeners.com/). Explanations: a. CI overlaps no effect and the upper and/or lower confidence limit crosses the minimal important difference (an effect size of 0.5 in either direction is used instead of calculating the effect size for each outcome measure). b. Total population size or number of events is less than 400. c. Inadequate allocation concealment in trials with >20% weight. d. P value for heterogeneity (chi square) is <0.05, I square is substantial >50%. High certainty means we are confident that the true effect lies close to that of the estimate of the effect. Moderate certainty means we are moderately confident in the effect estimate; the true effect is likely to be close to the estimate of the effect, but there is a possibility that it is substantially different. Low certainty means our confidence in the effect estimate is limited; the true effect might be substantially different from the estimate of the effect. Very low certainty means we have very little confidence in the effect estimate; the true effect is likely to be substantially different from the estimate of effect.23

