
Figure 1.
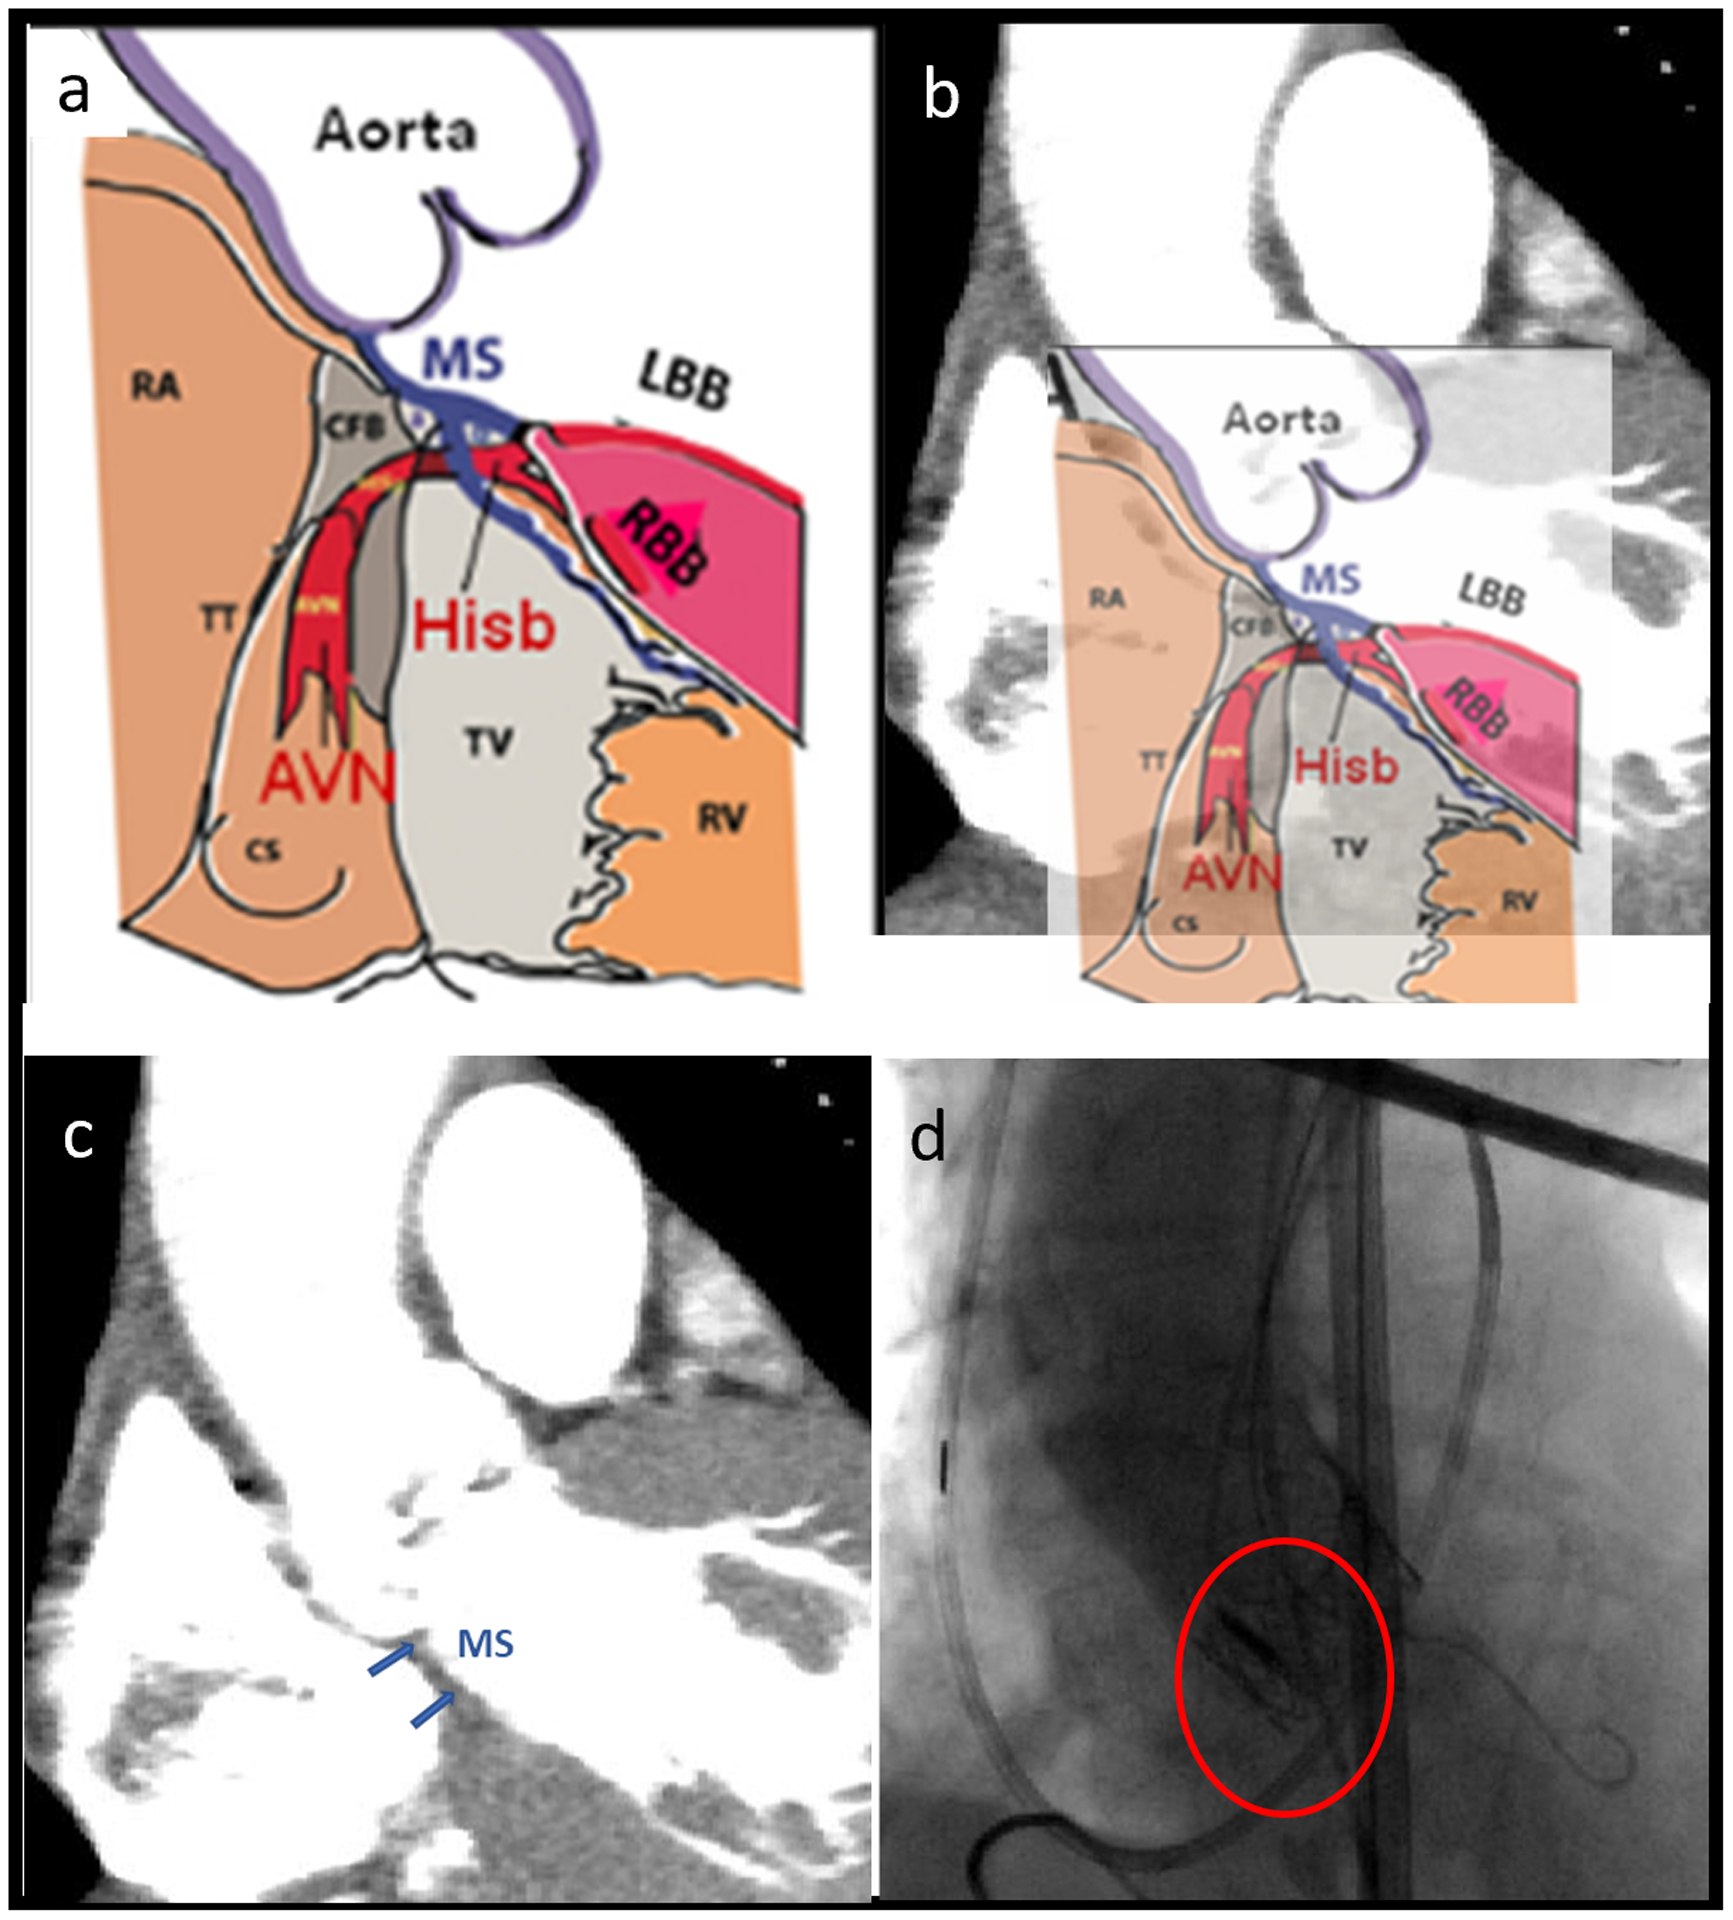
(a) Schematic of the aortic annulus, MS and Hisb40 (Used with permission from Cardiotext Publishing), (b) Schematic overlayed with the CTA image of the control patient (c) MS region identified in patient CTA image and (d) Post-TAVR angiogram shows the valve prosthesis compressing the MS region.