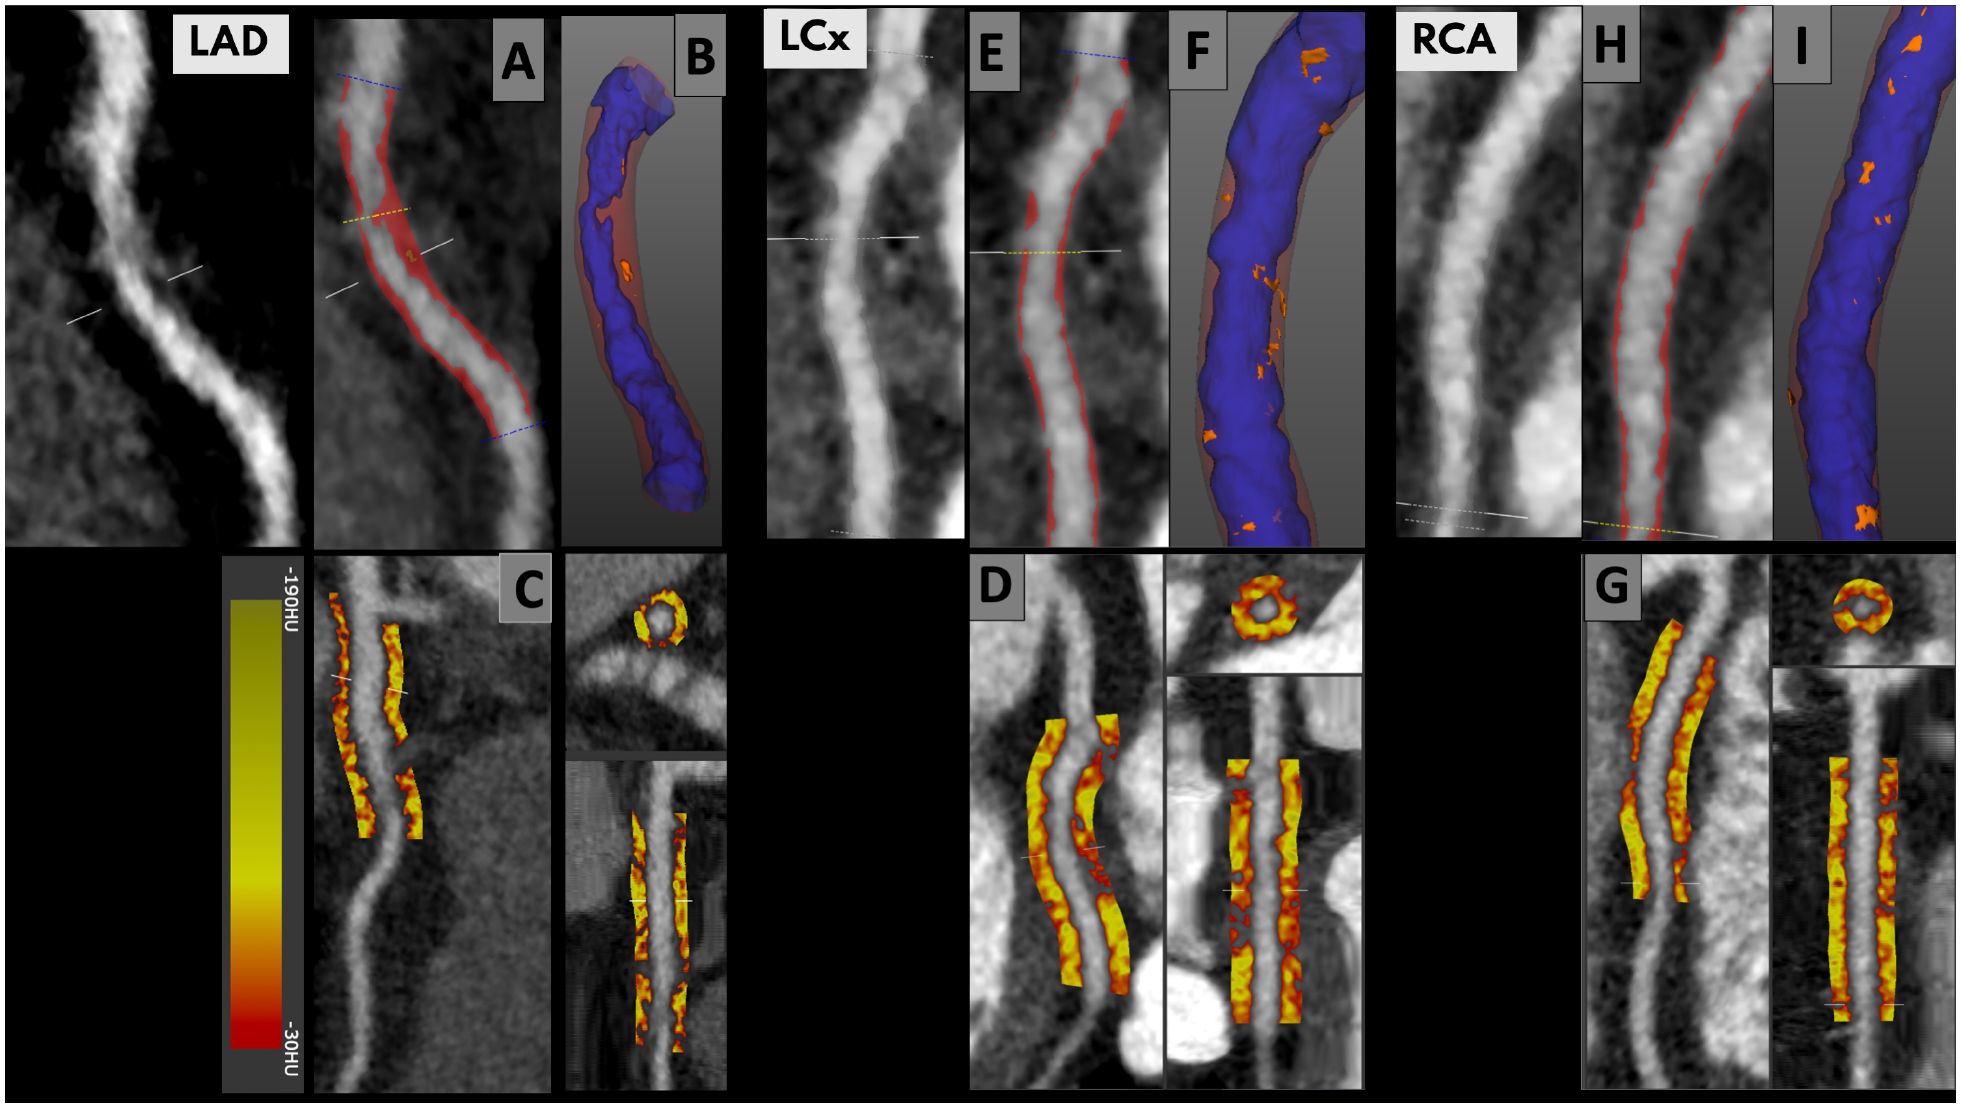
Figure 1:

Plaque burden (left upper panels; red is non-calcified plaque) with 3-dimensional plaque composition (right upper panels; orange is low attenuation non-calcified plaque) and peri-coronary adipose tissue quantification (lower panels) and in the left anterior descending artery (A-C), the left circumflex artery (D-F) and the right coronary artery (G-I). PCAT analysis focused on the proximal right coronary artery (10–50 mm from ostium), left anterior descending coronary artery (0–40 mm from left main stem bifurcation) and left circumflex (0–40 mm from left main stem bifurcation). We considered PCAT attenuation (reported in Hounsfield units [HU]) as the average attenuation of all adipose tissue containing voxels (range −190 HU to −30 HU) within an outer radial distance from the vessel wall of 3 mm.
