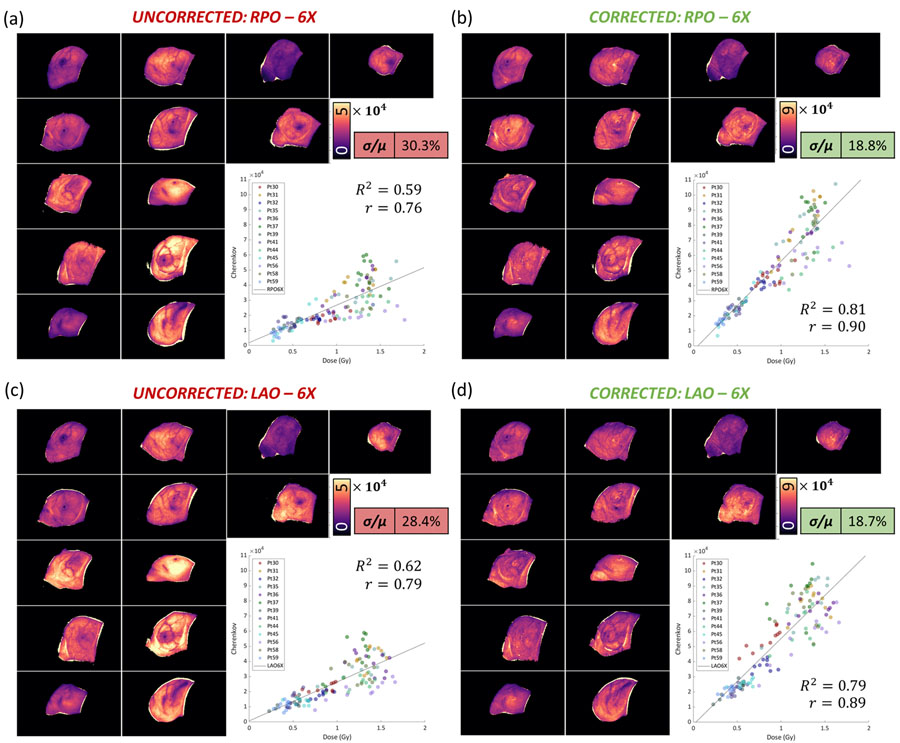
Figure 3:
Dose-Normalized images are organized into pre-CT correction (a), (c), and post-CT correction (b), (d), images for the 13-patient cohort. All thirteen patients were treated with 6 MV beams. In short, the qualitative disparity is evident from patient-to-patient moreso in the images not corrected by CT. The quantitative result is shown using the COV (σ/μ) is improved, as well as the strength of the linear regression.

