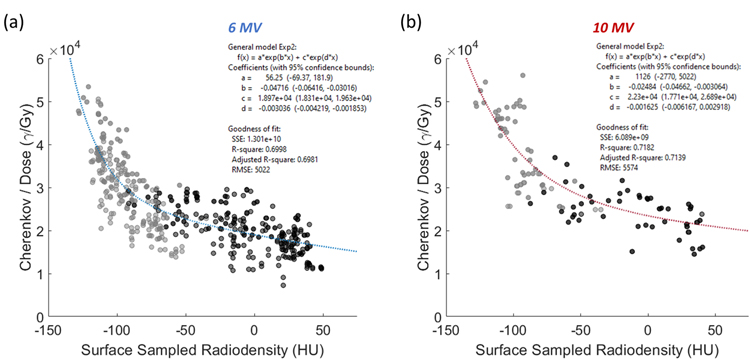
Figure 5:
In (a), the relationship between the CT# and the amount of Cherenkov light emitted per unit dose (for both 6 MV entrance and exit beams combined) is modeled using a summed exponential with an R2 of roughly 0.70. Recall that Cherenkov data has been dose normalized to render each image independent of incident beam energy. The darker gray points are representative of areas that were sampled in regions of substantial Cherenkov light attenuation, and the lighter gray points represent ROIs averaged from regions in the surrounding tissue, outside of any localized absorbing features. In (b), the same is shown for 10 MV data with a linear regression fit of R2 = 0.72.

